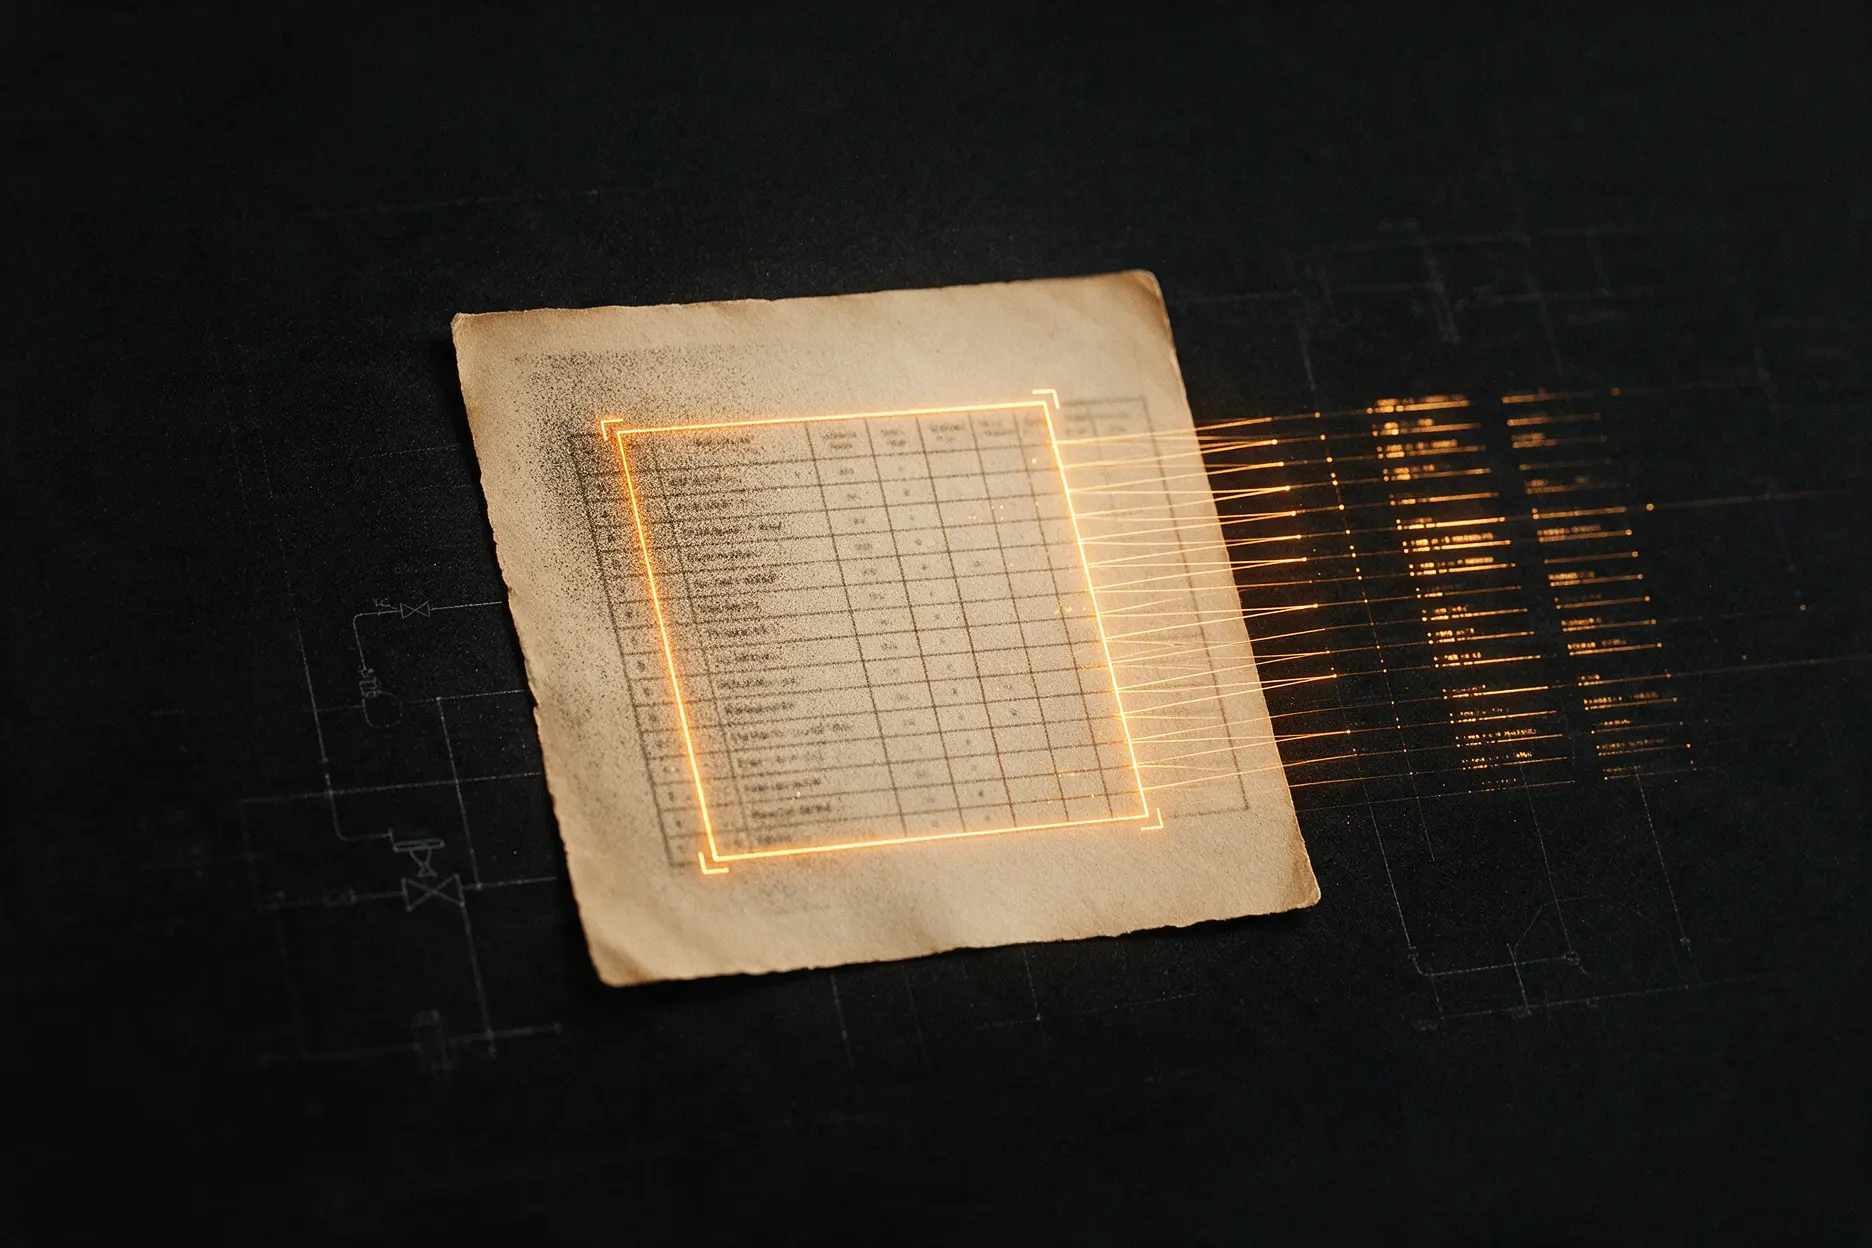
Reviewing existing solutions first
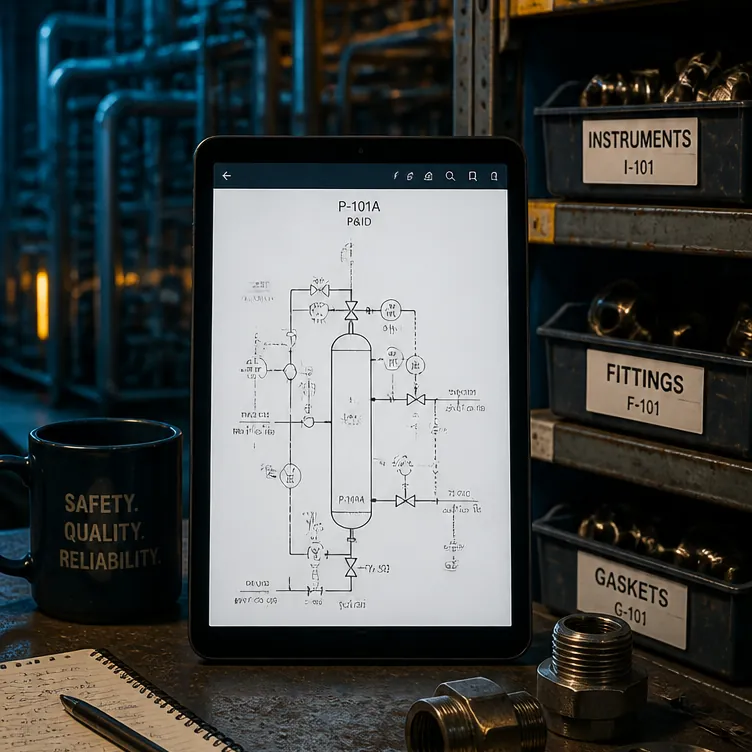
The team looked at what was already available before building anything. That review is what showed the ready-made options would not reach the quality the client needed.
What do you do when every off-the-shelf model fails on your scans, and the data still has to come out of the tables?
A large Middle Eastern oil and gas operator was processing PDFs, technical drawings, and scanned documents in a semi-manual way. Azati ran a full R&D cycle, from task setup and data labeling to models trained from scratch and production deployment, and replaced that process with a fully automated tabular-data extraction pipeline.
tabular-data extraction pipeline, replacing semi-manual document processing
from task setup and data labeling to production deployment
table detection and OCR models, trained in-house after off-the-shelf models fell short
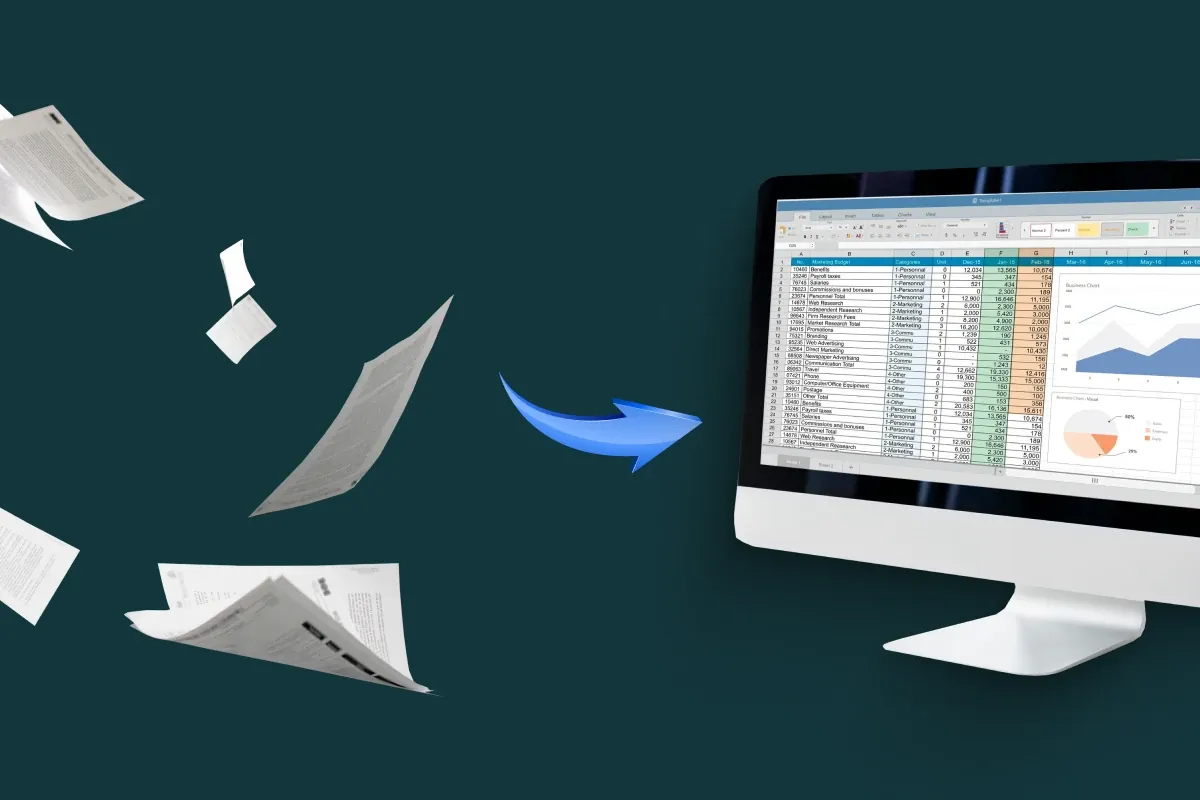
It replaced semi-manual handling of tables locked inside scans and PDFs with an automated pipeline that outputs structured data.
An oil and gas operator runs on documentation: PDFs, technical drawings, and scanned paper records, the kind of unstructured engineering data that is hard to search and reuse. The facts that matter often sit in tables, and a scan gives you a picture of a table, not data. Before this project, getting those values out was a semi-manual job.
The client needed a platform that could take these document types and return structured tabular data. Azati was brought in on the strength of its computer vision and document intelligence work, and the engagement ran for 12 months as a Dedicated Team.


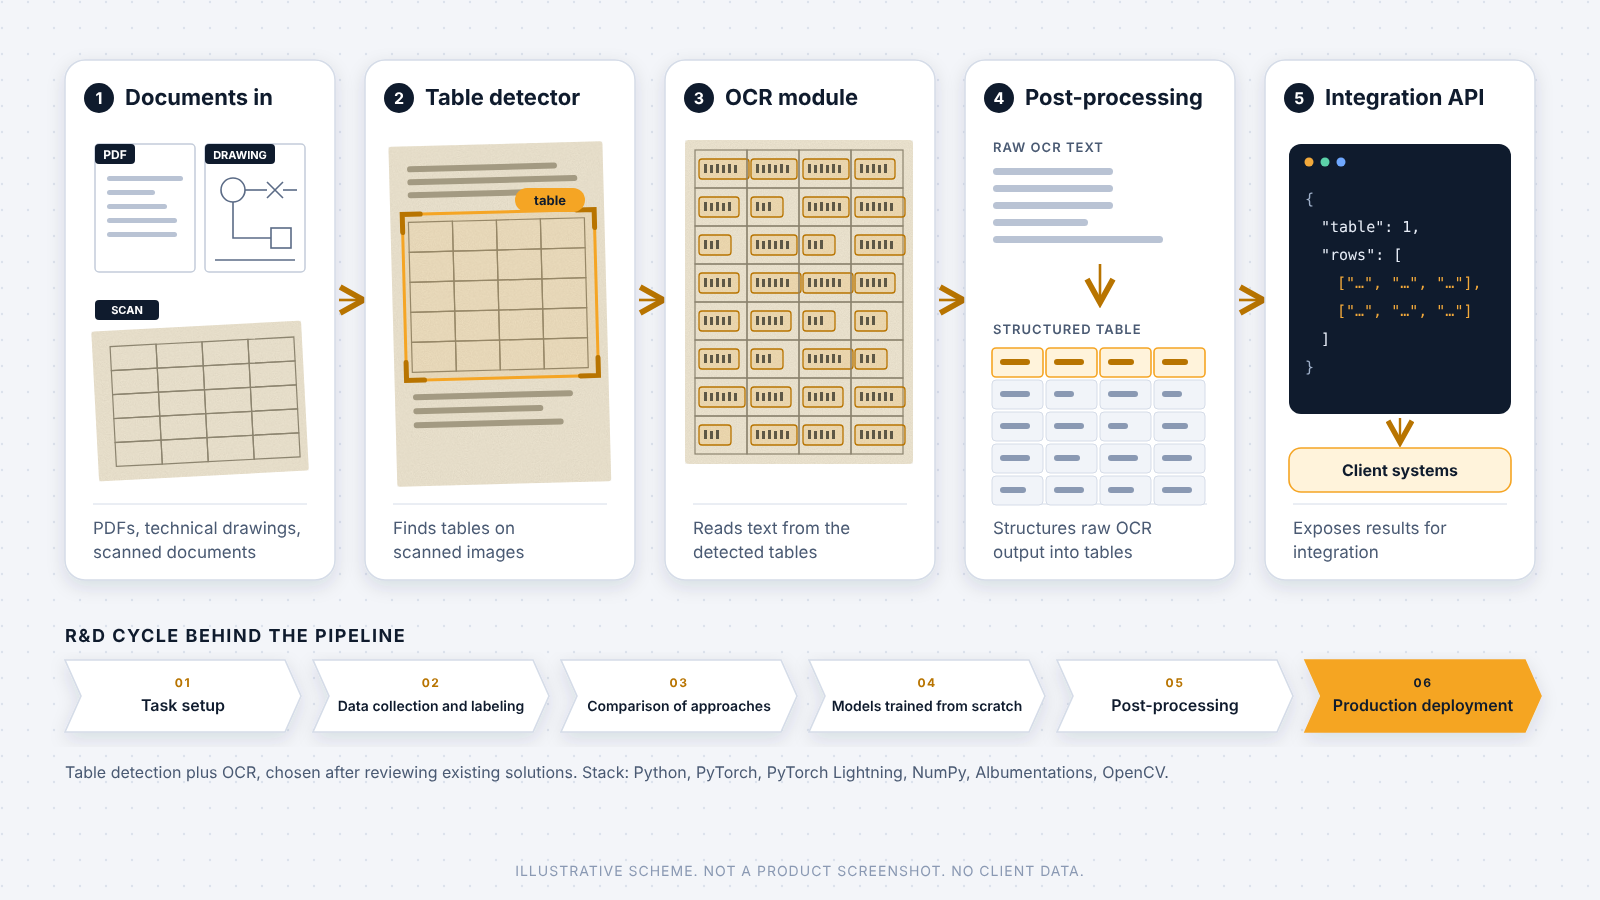
| Module | What it does |
|---|---|
| Table detector | Finds tables on scanned images. |
| OCR module | Extracts the text from the detected table regions. |
| Table structure detection | Recovers the structure of each table by segmentation, so layouts that are not regular grids can be read. |
| Post-processing | Turns recognized text and detected structure into structured tabular data. |
| Integration API | Exposes the pipeline's results for integration with other systems. |
The obvious route, plugging in a pretrained model, did not work on this client's documents, and every alternative needed its own experiments.
The team started by reviewing existing solutions, and the answer was clear quickly:
Training from scratch needs labeled data, and how you label decides what the model can learn:
The platform had to handle a range of inputs, not a single clean format:
By treating it as research: test what exists, choose an approach, label data, train from scratch, and only then build the product around the models.
The team looked at what was already available before building anything. That review is what showed the ready-made options would not reach the quality the client needed.
Azati split the task into two steps: find the table, then run OCR data extraction on it.
Existing solutions were largely built around column detectors, which would have limited the platform. Azati framed table structure detection as a segmentation task, an unusual choice that handles layouts which are not regular grids.
The team set up the task, collected the data, and labeled it, trying many labeling approaches along the way.
With a labeling scheme that worked, the team trained both models in-house. The toolchain included Python, PyTorch Lightning, and Albumentations.
Raw OCR output is not yet data. The team wrote the post-processing that structures it, wrapped the pipeline in an integration API, and deployed it to production.
Send us a few representative documents. We will tell you whether table detection plus OCR fits them, and what the first round of data labeling would need to look like.
Automate my document data extractionFive modules that work as one pipeline: a table detector, an OCR module, table structure detection, a post-processing layer, and an integration API.
The detector locates tables on scanned pages. It was trained from scratch on data the team collected and labeled for this client.
The OCR module extracts text from detected tables. Like the detector, it was trained in-house rather than taken off the shelf.
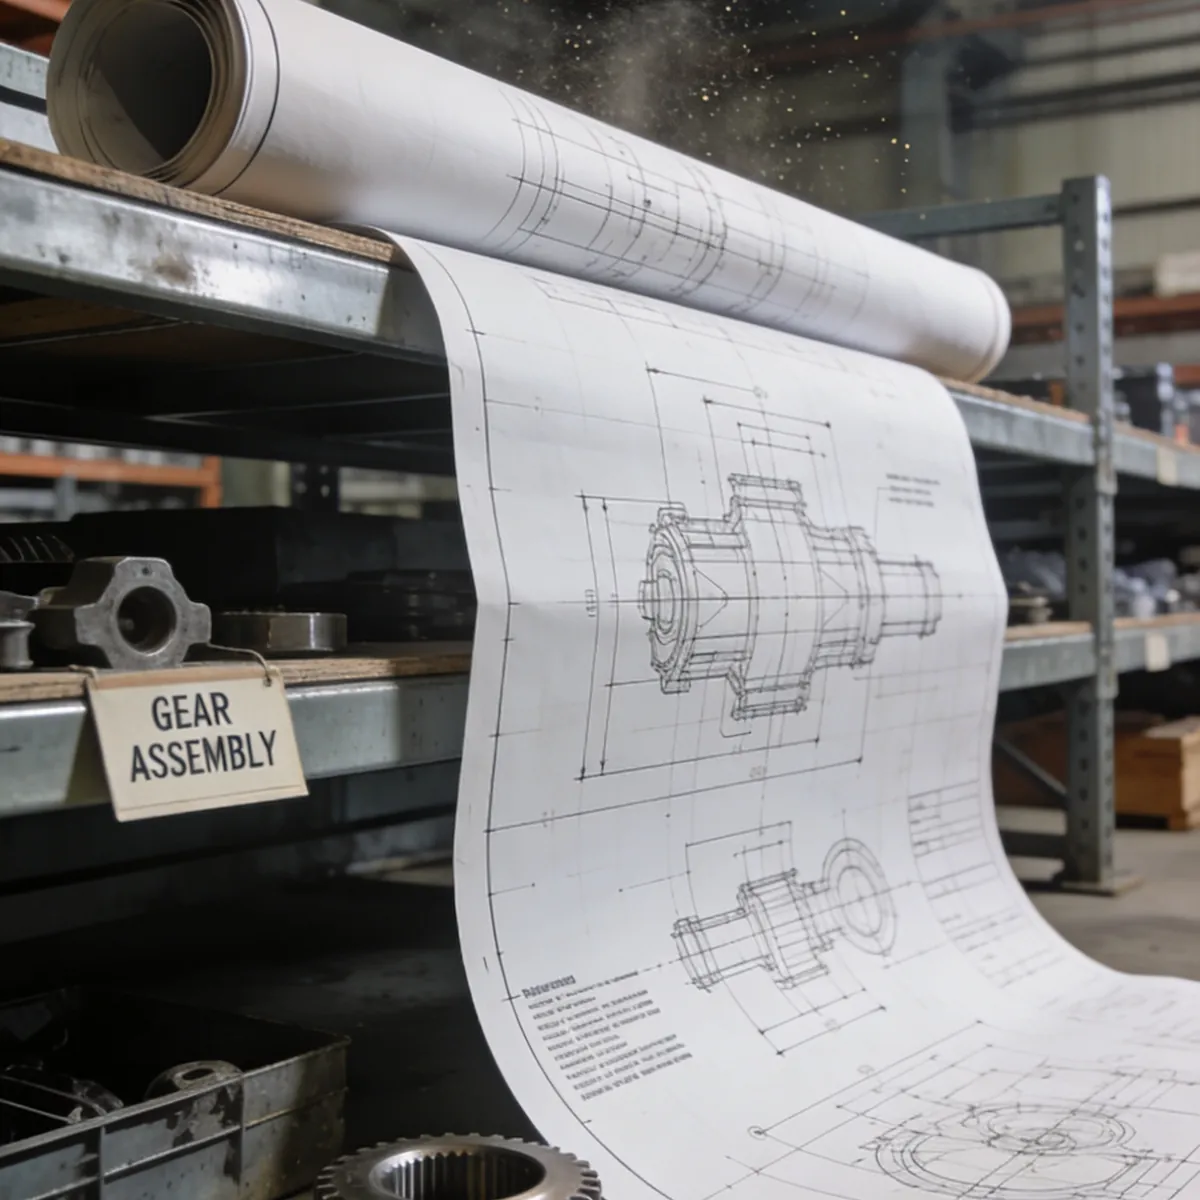
Existing solutions were largely built around column detectors, which would have limited the platform. Azati approached table structure as a segmentation task instead, an unusual choice for this kind of solution. It made it possible to extract data even from scanned AutoCAD drawings, where the title block in the bottom right corner has a tabular structure but is really a tetris of blocks.
This layer converts recognized text and detected structure into structured tabular data.
An API for integration exposes the pipeline's results to other systems.
| Area | Before Azati | After Azati |
|---|---|---|
| Document processing | Semi-manual | Fully automated pipeline |
| Tabular-data extraction | Dependent on a manual step | Automated, from scan to structured data |
| Model quality | Off-the-shelf models with weak extraction quality | Detection and OCR models trained from scratch |
| Approach | Existing solutions reviewed first | Table detection plus OCR, chosen after that review |
It removed the manual step from table extraction and gave the client a fully automated tabular-data pipeline.
The engagement did not report numeric benchmarks, so the honest summary is about process: what used to need a person now runs end to end.
Table data no longer depends on semi-manual processing. Documents enter the pipeline and structured data comes out.
PDFs, technical drawings, and scanned documents are covered by one platform, including the title blocks of scanned AutoCAD drawings.
The detector and OCR were trained in-house on data the team collected and labeled, after ready-made models showed weak extraction quality.
The platform exposes its results through an API for integration with other systems.
The client kept working with Azati after this engagement.
Three lessons: read the research before you buy the plugin, treat labeling as a modeling decision, and choose the approach after comparing, not before.
When ready-made models fell short, the team read scientific papers and ran its own research. That habit is the expertise that stays inside Azati after the project.
The team tried many ways of labeling documents. Labeling was treated as part of the research, not as a task finished before it.
The team compared existing solutions and approaches before settling on table detection plus OCR. The approach was the outcome of that comparison.
| What to check | Why it matters | When it becomes urgent |
|---|---|---|
| Pretrained models on your own scans | Benchmark quality often does not hold on real documents, and this is cheap to test. | Before any decision to build or buy. |
| Labeling approach | The way you label sets the ceiling for what a trained model can learn. | When off-the-shelf models fall short and training becomes necessary. |
| Detection separate from OCR | Two focused models are easier to measure and improve than one that does everything. | When documents mix tables with drawings or other content. |
| Output and integration | Extracted data only matters if it reaches the systems that use it. | When the pipeline moves from a pilot to production. |
Azati ran the project as a Dedicated Team led by team leads.
A Dedicated Team suits research-heavy work, where the route to production is found through experiments.
The same Azati team handled task setup, data labeling, model training, post-processing, and deployment.
Azati delivered the project with its own engineers from start to finish.
It fits organizations whose key data sits in tables inside scans, PDFs, or technical drawings, and where off-the-shelf OCR does not reach usable quality.
If you're the one who has to explain to a CFO or operations head why a generic OCR tool is not enough for your scans, this FAQ is written for that conversation.
Automatic extraction works in stages: detect the tables, read their text with OCR, then structure the result.
Azati built exactly this pipeline for an oil and gas operator, with a table detector on scanned images, an OCR module, table structure detection, post-processing, and an API for integration.
Azati trained its own models because many ready-made models showed weak extraction quality on the client's documents.
After reviewing existing solutions, the team chose table detection plus OCR and trained both from scratch on labeled client data.
The platform extracts data from a range of document types, including PDFs, technical drawings, and scanned documents.
Its table detector works on scanned images, and the OCR module reads the detected tables.
A full R&D cycle covers task setup, data collection and labeling, comparison of approaches, model training, post-processing, and production deployment.
Azati's team carried this project through every one of these steps in 12 months.
The client moved from semi-manual document processing to a fully automated pipeline for extracting tabular data.
The engagement did not publish numeric benchmarks, so Azati describes the result as a change in process: the manual step is gone, and extraction runs end to end.
A title block looks like a table but is built from irregular blocks, so column detection does not fit it.
Azati's platform treats table structure detection as a segmentation task, which lets it extract data from the title block in the bottom right corner of scanned AutoCAD drawings.
Azati built the platform in Python with PyTorch, PyTorch Lightning, NumPy, Albumentations, and OpenCV.
The models for table detection and OCR were trained in-house, and the platform exposes its results through an integration API.
Azati delivered the project as a Dedicated Team over 12 months, without third-party vendors.
The client continued working with Azati after this engagement.
Bring a sample of your hardest scans. We will review them with you and outline what a detection plus OCR pipeline would take on your data.
Talk to our document AI teamExplore our successful projects and see how Azati delivers measurable results for our clients.
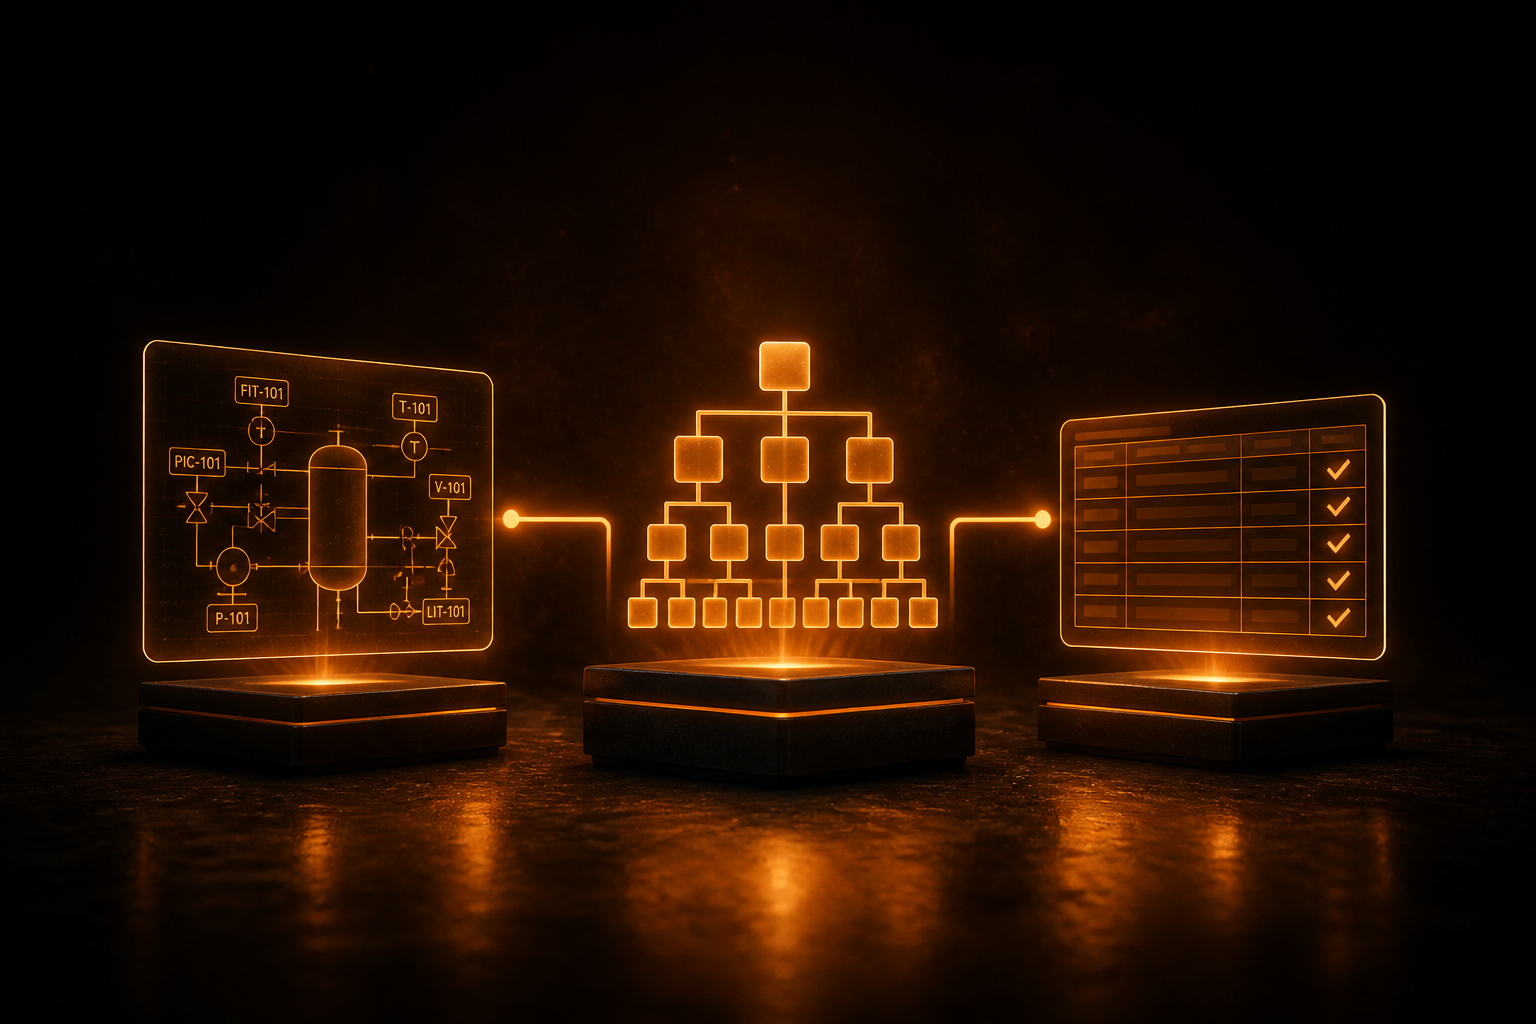
A large oil and gas engineering operator needed tag data extracted and classified from engineering drawings, categorized for AVEVA Engineering tables, and equipment connections identified from wiring diagrams. The manual process required multiple engineers and could not keep pace with document volume.
Azati built a full pipeline from data annotation to production that extracts and classifies tags, identifies equipment connections, and generates structured AVEVA Engineering tables, delivered in three months.
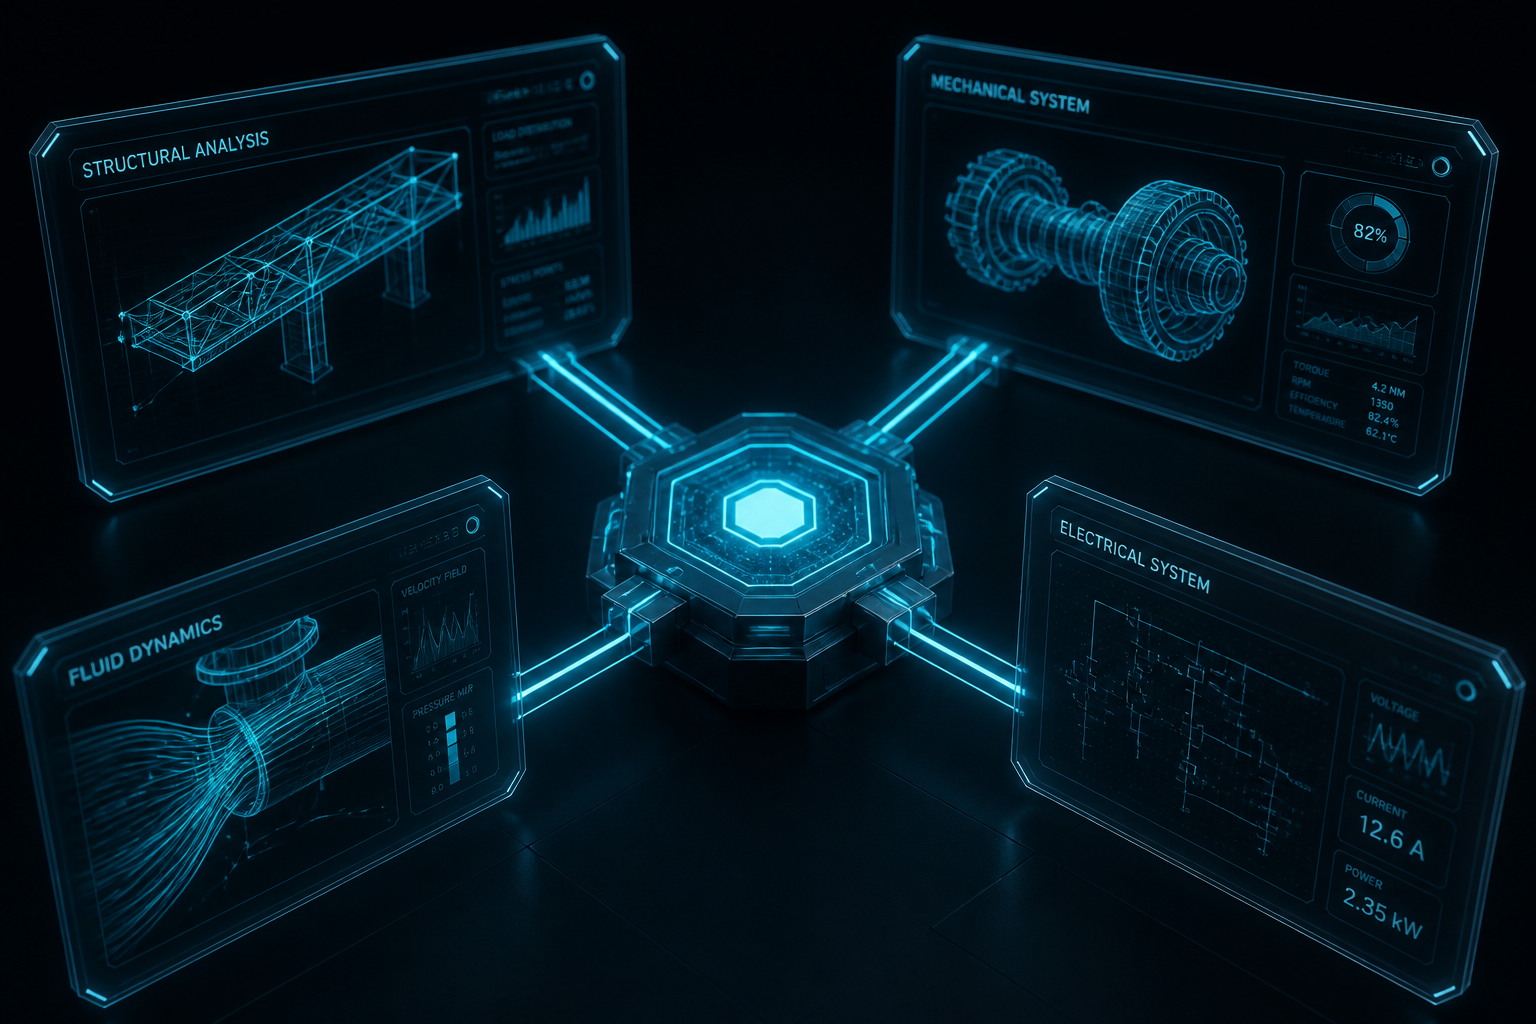
A refining and petrochemical operator was extracting equipment tags and attributes from engineering drawings by hand, across four structurally different document types: P&ID, fire and gas loop diagrams, HVAC schematics, and electrical one-line diagrams.
Azati built a computer vision and OCR pipeline that detects objects, matches tags, classifies equipment, and extracts attributes automatically, packaging the result for direct upload into the client's engineering data platform.
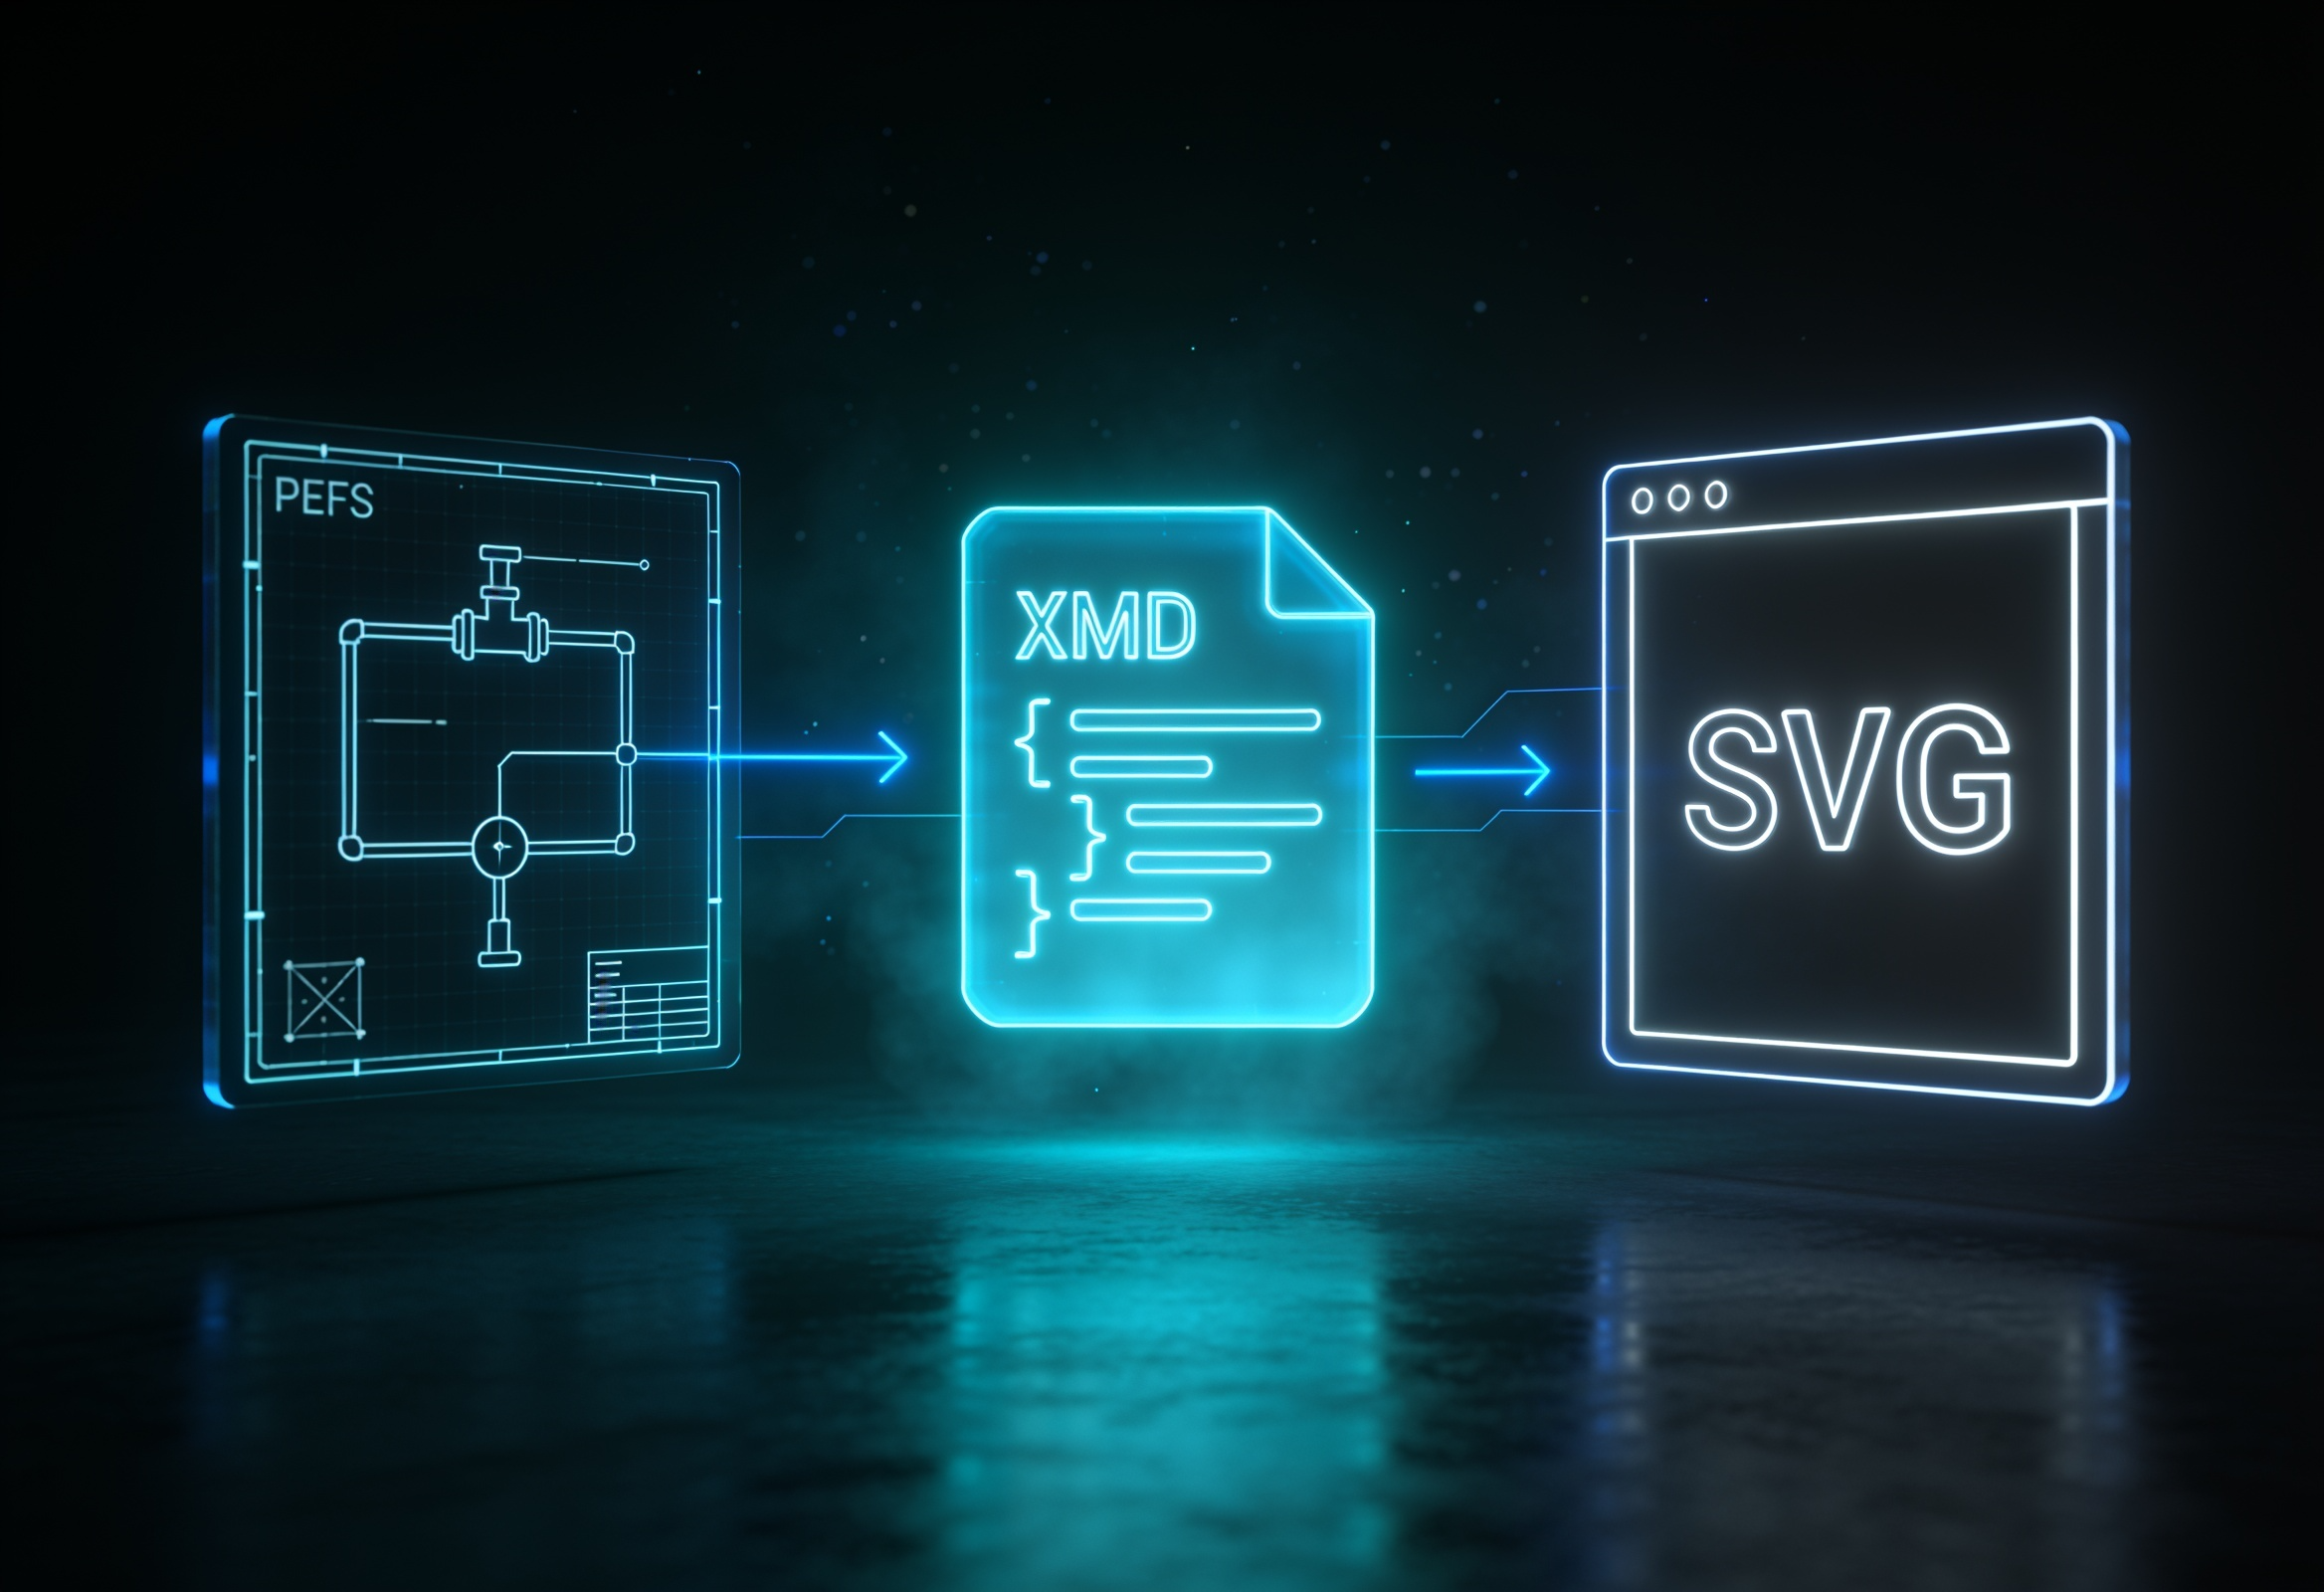
A large Middle Eastern oil and gas operator held 35,000 PEFS files across AutoCAD, PDF, TIFF, and JPEG formats, with no way to search them by equipment or process element.
Azati built an AI-powered pipeline that extracts and classifies data from these drawings, converts them to the DEXPI industry standard via Proteus XML, validates the output, and generates SVG visualizations.
Last updated