Automated Tag Extraction and AVEVA Table Generation from Engineering Drawings

How do you extract, classify, and structure tag data from engineering drawings fast enough to matter?

A large oil and gas engineering operator needed tag data extracted and classified from engineering drawings, categorized for AVEVA Engineering tables, and equipment connections identified from wiring diagrams, fast enough to replace a multi-engineer manual process. Azati built the full pipeline in three months, processing up to 300 documents per hour.

Automate my drawing data extraction
300

engineering documents processed per hour by the extraction pipeline

3

months to deliver the full MLOps pipeline from data annotation to production

Multi-level

tag classification using visual context from drawings, not template matching

Technologies used

Python
Python
PyTorch
PyTorch
OpenCV
OpenCV
FastAPI
FastAPI
AWS
AWS
Docker
Docker

Motivation

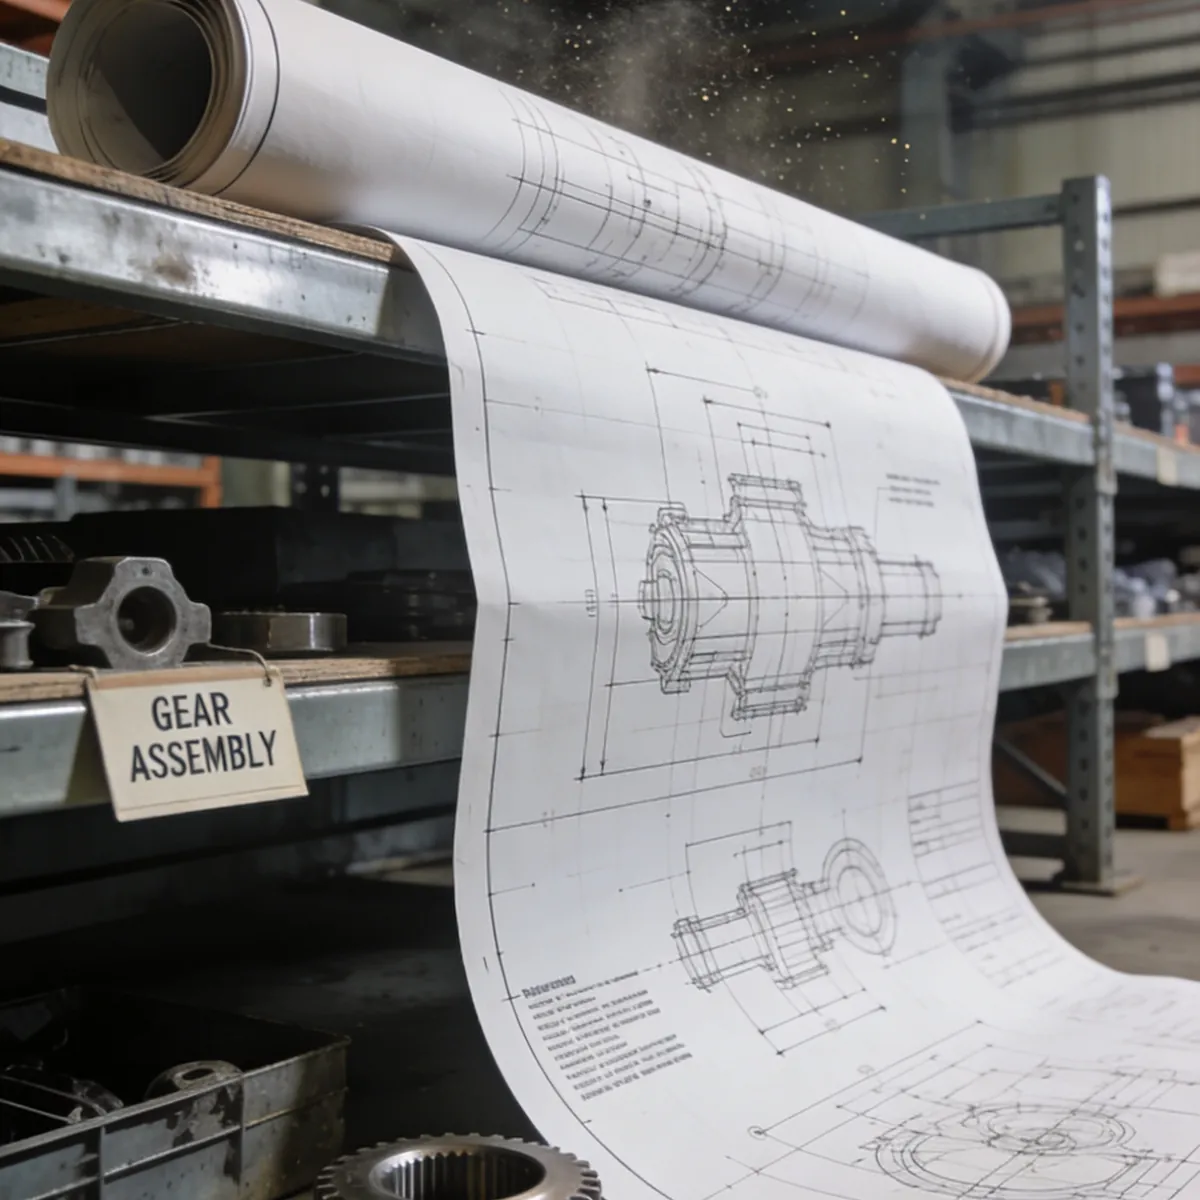
Every tag on an engineering drawing is a promise: find this equipment, trace this connection, confirm this attribute, in seconds, not hours. Reading that data by hand at any real volume eats engineering time no project budget survives, and the problem compounds because the same tag can mean one thing in a P&ID and something else entirely in a wiring diagram, correct classification is a judgment call, not a lookup. Wiring diagrams add a second layer: connections are drawn, never written down, so the equipment a wire connects to has to be traced through geometry, not text.

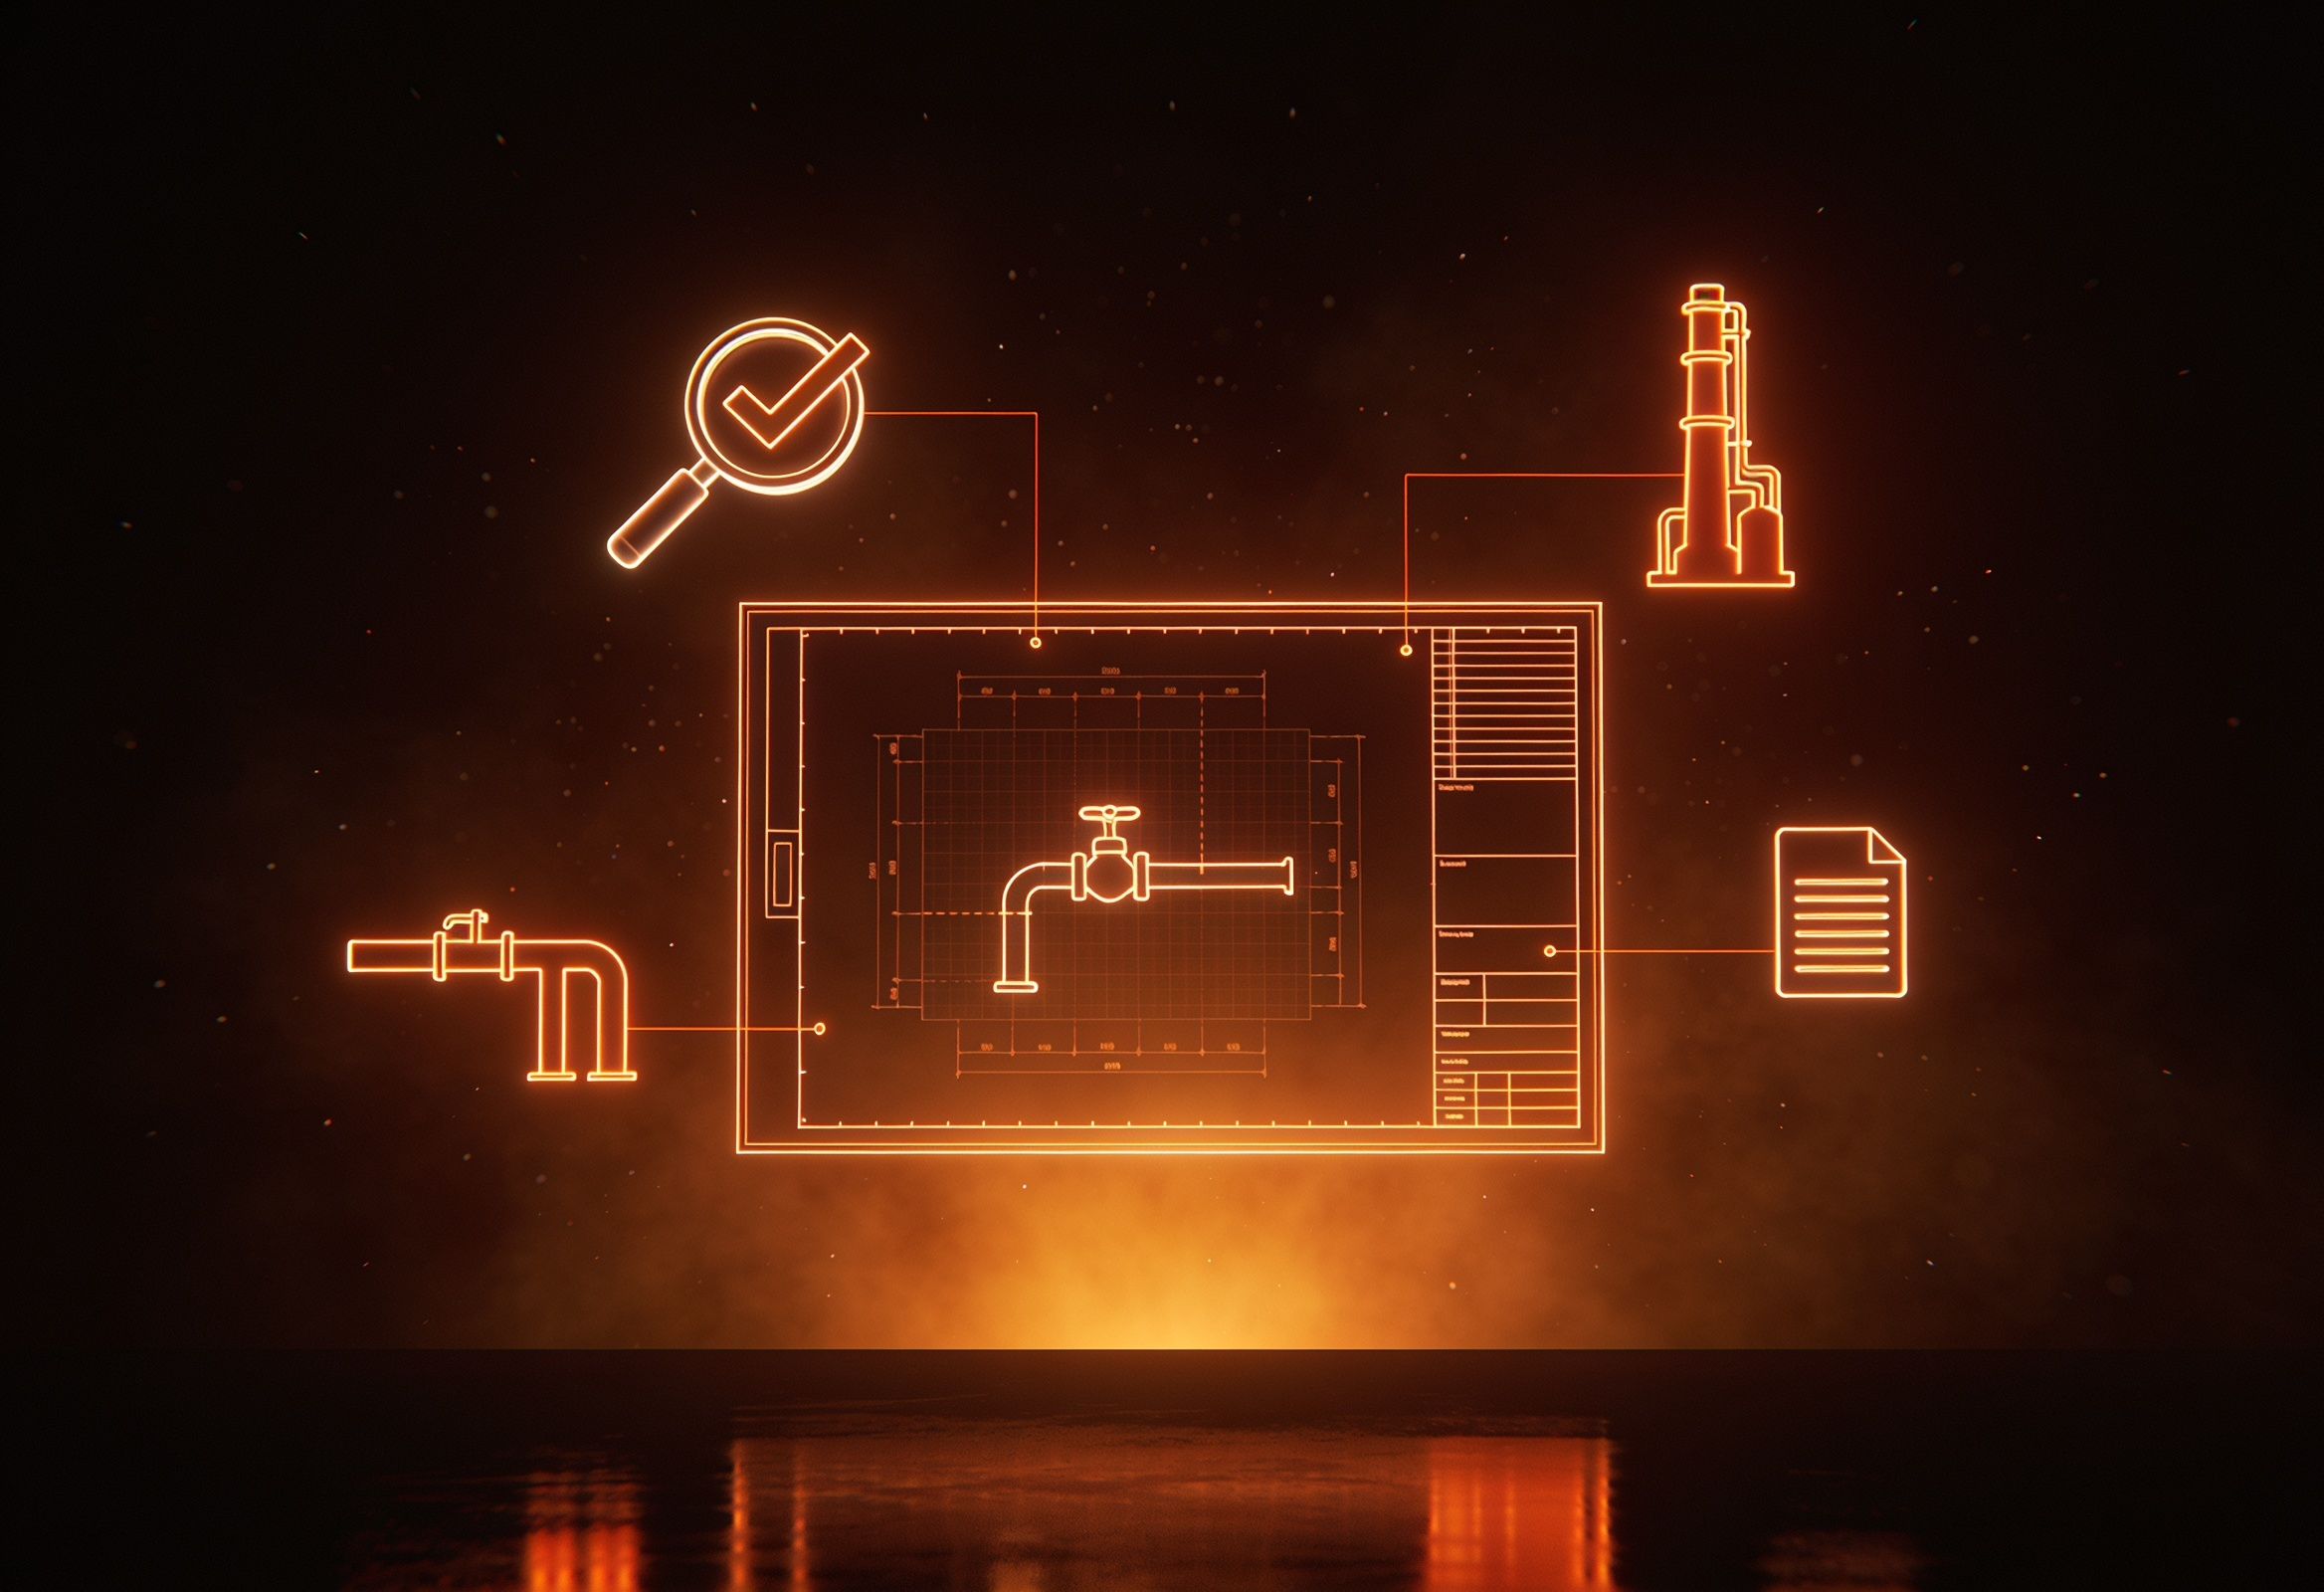
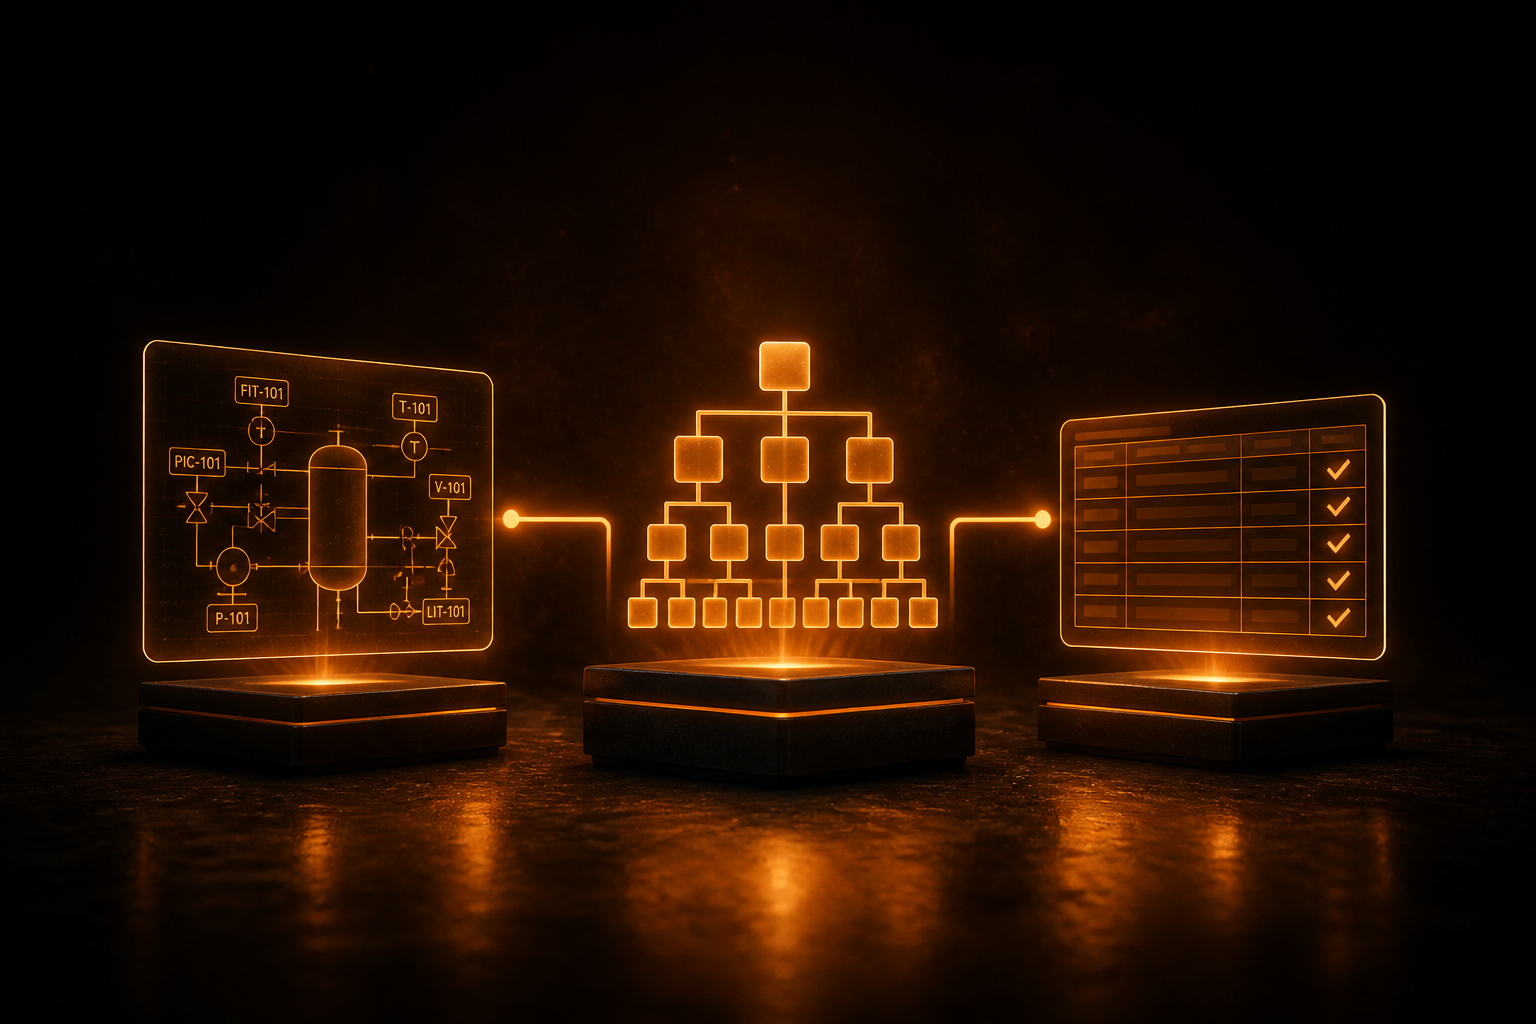
Azati built the answer as one pipeline: text extraction, symbol identification, multi-level tag classification through visual context, connection determination from wiring geometry, and AVEVA table generation, ready for an engineer to review and sign off. Delivered in three months. Running at 300 documents an hour.
What makes engineering drawing extraction hard to automate?

Challenge 01

The same tag can mean two different things

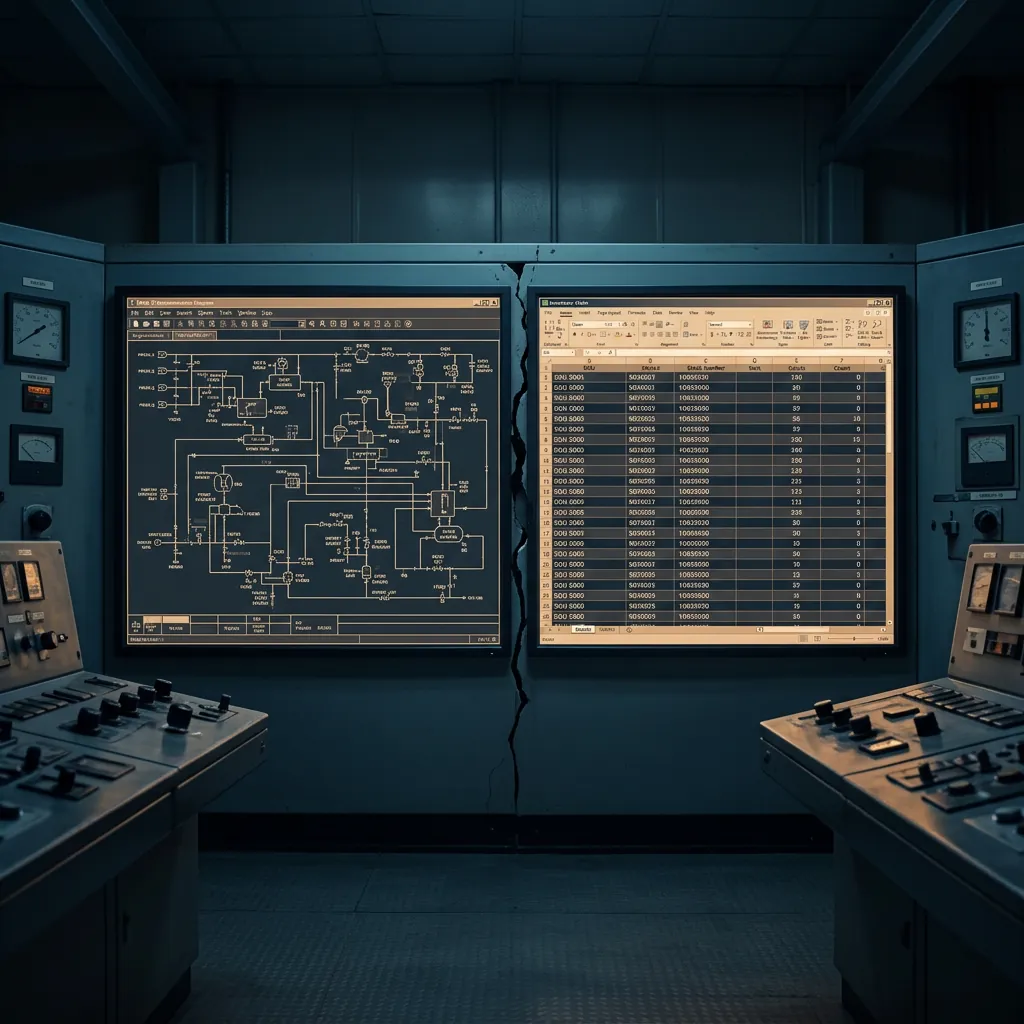
A tag that marks one equipment category on a P&ID can indicate a completely different category on a wiring diagram for the same facility. Template-based extraction systems assume a fixed mapping between a tag and its meaning, an approach generic P&ID digitization tools still rely on, so they break silently here, producing confident, wrong answers rather than flagging the ambiguity. Correct classification meant treating every tag as a question to be answered by reading its surroundings, not a string to be looked up:

  • Properly tag identification across multiple document types
  • Category only resolvable from visual context, never from the tag text alone
  • Cross-referencing multiple drawings required to remove ambiguity
  • No single template that covers the full document set
#1
Challenge 02

Wires never write down what they connect to

Wiring and electrical diagrams encode connectivity spatially: a line drawn from one symbol to another means those two pieces of equipment are wired together, and that fact exists nowhere as text. Determining which equipment a given wire connects to requires understanding the geometric layout of the drawing, tracing the physical path a line takes across the page, and interpreting spatial relationships between symbols, a fundamentally different task from anything a text extraction tool was built to do:

  • Connection data present only in drawing geometry, never in text
  • Wire tracing demanding real spatial reasoning, not pattern matching
  • Symbol identification as a prerequisite before any connection logic runs
  • Different diagram conventions and equipment types across document sets, each with its own quirks
#2
Challenge 03

No phase could wait for another to finish

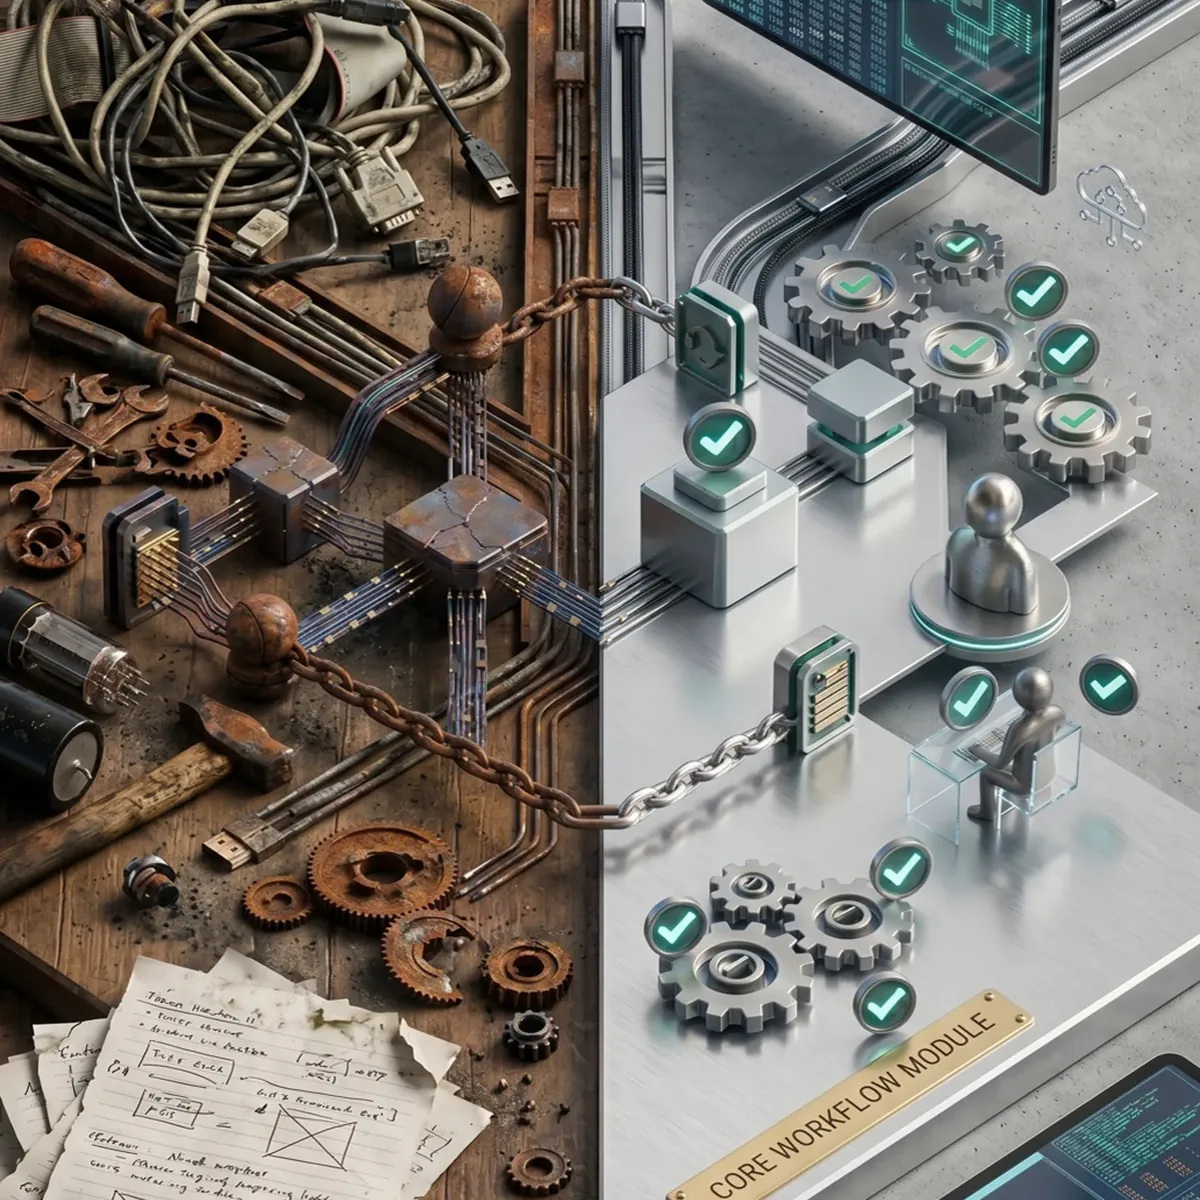
A pipeline that spans data annotation, model training, integration, and production delivery normally has room to let each phase breathe. This project didn't have that room. Every phase had to run efficiently and, wherever possible, in parallel with the others, with annotation and model development moving at the same time rather than one waiting on the other to finish:

  • CVAT annotation running in parallel with model development, not after it
  • Weights and Biases tracking every experiment so nothing got re-run blind
  • DVC keeping data versions straight across fast-moving annotation iterations
  • Pipeline integration and production delivery landing inside the same sprint window as the last training run
#3

How Azati delivers a production ML pipeline in three months

Annotation and infrastructure move together

The pipeline began with structured annotation of engineering drawing datasets in CVAT, with DVC managing data versions across every annotation iteration so nothing got lost or overwritten as the dataset grew. Critically, this phase ran in parallel with infrastructure setup rather than sequentially after it, which is the decision that made a three-month delivery timeline realistic rather than aspirational.

Every experiment stays traceable

Models were trained using PyTorch Lightning, with Weights and Biases tracking every single experiment: hyperparameters, metrics, and artefacts, all logged automatically. That discipline turned model selection into a traceable, reproducible decision backed by data, not a judgment call based on whoever happened to run the last notebook before a deadline.

Production traffic from day one

The classification and extraction logic was wrapped in a FastAPI service layer, containerised with Docker, and deployed on AWS with S3 handling document and artefact storage underneath. What came out the other end was a production pipeline processing up to 300 engineering documents per hour, with engineers reviewing structured output rather than performing the extraction themselves.

Why oil and gas engineering teams trust Azati with tag extraction at scale

Context beats templates

Tag category comes from reading the drawing itself, sequentially, the way an engineer would: what type of drawing is this, what surrounds the tag, what other symbols are present. That's why the same tag can be correctly classified two different ways in two different documents, and why new drawing formats need fine-tuning, not a rebuild.

MLOps from day one, not bolted on later

CVAT annotation, PyTorch Lightning training, Weights and Biases tracking, DVC versioning, FastAPI serving, Docker and AWS underneath. Every piece of that stack was there from the first week, which is the only reason three months was enough.

A team replacement, not a speed bump

300 documents an hour is what a team of engineers would need weeks to match. This isn't shaving time off a manual process, it's removing the manual process from the extraction and classification work entirely and leaving engineers to do what they're actually good at: judgment calls on the edge cases.

Still extracting engineering drawing data by hand?

Tag classification, equipment connections, AVEVA table generation, Azati built the full pipeline in three months. Let's talk about yours.

Get my extraction pipeline built

How the extraction and classification pipeline works

Four stages, one pipeline: drawings go in, structured AVEVA tables come out, and engineers spend their time reviewing rather than extracting.

01

Text extraction and symbol identification

OCR and PDF processing pull every piece of text off the page. Computer vision models trained on engineering symbol libraries find every piece of equipment. Between the two, the pipeline knows what's on the drawing before it tries to make sense of it.

Key capabilities:
  • OCR-based text extraction across document formats
  • Equipment symbol identification via computer vision
  • Tag identification across drawing types
  • Foundation layer for all downstream classification
02

Multi-level tag classification through visual context

This is the stage that actually solves the hard problem. No lookup table. The system reads which drawing type it's on, what's around it, and cross-references other documents where needed, then classifies. It's the reason the same tag can end up correctly filed under two different categories depending on where it appears.

Key capabilities:
  • Sequential visual context analysis for tag classification
  • Cross-document disambiguation of tag categories
  • Document-adaptive classification without per-type hardcoding
  • Correct handling of same-tag different-category cases
03

Equipment connection determination from wiring diagrams

Wires don't announce what they connect to, they just get drawn there. This stage traces the geometry, symbol to symbol, to reconstruct the connections a text-only tool would never see.

Key capabilities:
  • Wire tracing from spatial geometry on wiring diagrams
  • Equipment-to-wire connection identification
  • Electrical diagram topology analysis
  • Attribute population for wiring connection data
04

Attribute formation and AVEVA table generation

Everything converges here: classified tags, resolved connections, full attribute sets, assembled into the AVEVA Engineering table format ready for upload. What an engineer receives is a finished draft, not a pile of raw extraction to sort through.

Key capabilities:
  • Tag attribute assembly including connection data
  • AVEVA Engineering table format generation
  • Engineer review and correction workflow
  • Ready-for-upload structured output

What Azati built

AreaWhat was delivered
Text extractionOCR and PDF-based text extraction across engineering document formats
Symbol identificationComputer vision models identifying equipment symbols on drawings
Tag classificationMulti-level visual context classification pipeline
Connection detectionWire tracing and equipment connection identification from wiring diagrams
Report generationAVEVA Engineering table generation from classified tag data
Data annotationCVAT-based annotation of training data across document types
MLOpsFull pipeline with DVC, Weights and Biases, FastAPI, Docker, and AWS
ThroughputUp to 300 engineering documents processed per hour

Security

The pipeline runs on AWS infrastructure with S3 storage for document and model artefact management. All processing is containerised with Docker for consistent, reproducible deployments across environments.

Team composition

A focused specialist team, not a large bench: ML engineering, data engineering, and backend development running in parallel from week one.

  • ML Engineer owning model architecture, training pipeline, and experiment tracking in Weights and Biases.
  • Data Engineer running CVAT annotation workflows, DVC versioning, and dataset quality across iterations.
  • Python Developer building the FastAPI service layer, Docker containerisation, and AWS integration.

Results & business impact

The math changes at 300 documents an hour

What used to need a team working for weeks now runs in a single working day. That's not marginal, it's a different cost structure for engineering data extraction altogether.

Engineers stopped being data-entry clerks

Reviewing structured output and spot-correcting edge cases is a fundamentally different job than manually reading drawings tag by tag. Same expertise, better use of it.

Ambiguity stopped being a blocker

The classification logic gets the tricky cases right, the same tag meaning different things in different drawings, without a human resolving every instance by hand.

A reusable MLOps foundation, not a one-off script

DVC, Weights and Biases, and CVAT didn't just ship this pipeline, they're now the default toolkit for whatever engineering document AI Azati builds next.

Strategic wins

What this engagement demonstrates:

Classification is a seeing problem, not a reading problem

You can't determine a tag's category from the tag. You have to look at the drawing around it: the symbols, the layout, the document type. Text extraction gets this wrong at scale. Computer vision reasoning gets it right, which is the same lesson behind Azati's broader P&ID digitization work.

Three months is a discipline problem, not a scope problem

Annotation, training, versioning, integration, and deployment all fit inside one quarter because they ran in parallel from day one. Sequential phases would have blown the timeline before the second month started.

Adaptive beats bespoke every time it scales

A pipeline that reads document content instead of matching a fixed template carries forward to new formats and new clients with fine-tuning, not a rebuild. That compounding is where the real return sits.

Ready to stop extracting engineering data by hand?

Multi-level tag classification, equipment connection detection, AVEVA table generation, the full pipeline, built and delivered in three months.

Stop extracting data by hand

The described expertise is relevant for

Related case studies

Explore our successful projects and see how Azati delivers measurable results for our clients.

3D Digital Twin Platform for Building Scanning and Analysis
Construction & Real Estate

3D Digital Twin Platform for Building Scanning and Analysis

24 months of full-cycle product engineering, from MVP features to production infrastructure
3 3D rendering engines integrated in one platform — Three.js, Autodesk APS Viewer, and Potree
End-to-end scan-to-view workflow delivered, from hardware device to browser-based 3D digital twin
  • Angular
  • NestJS
  • Three.js
  • AWS
  • Terraform

⚡ Pain Points We Tackled

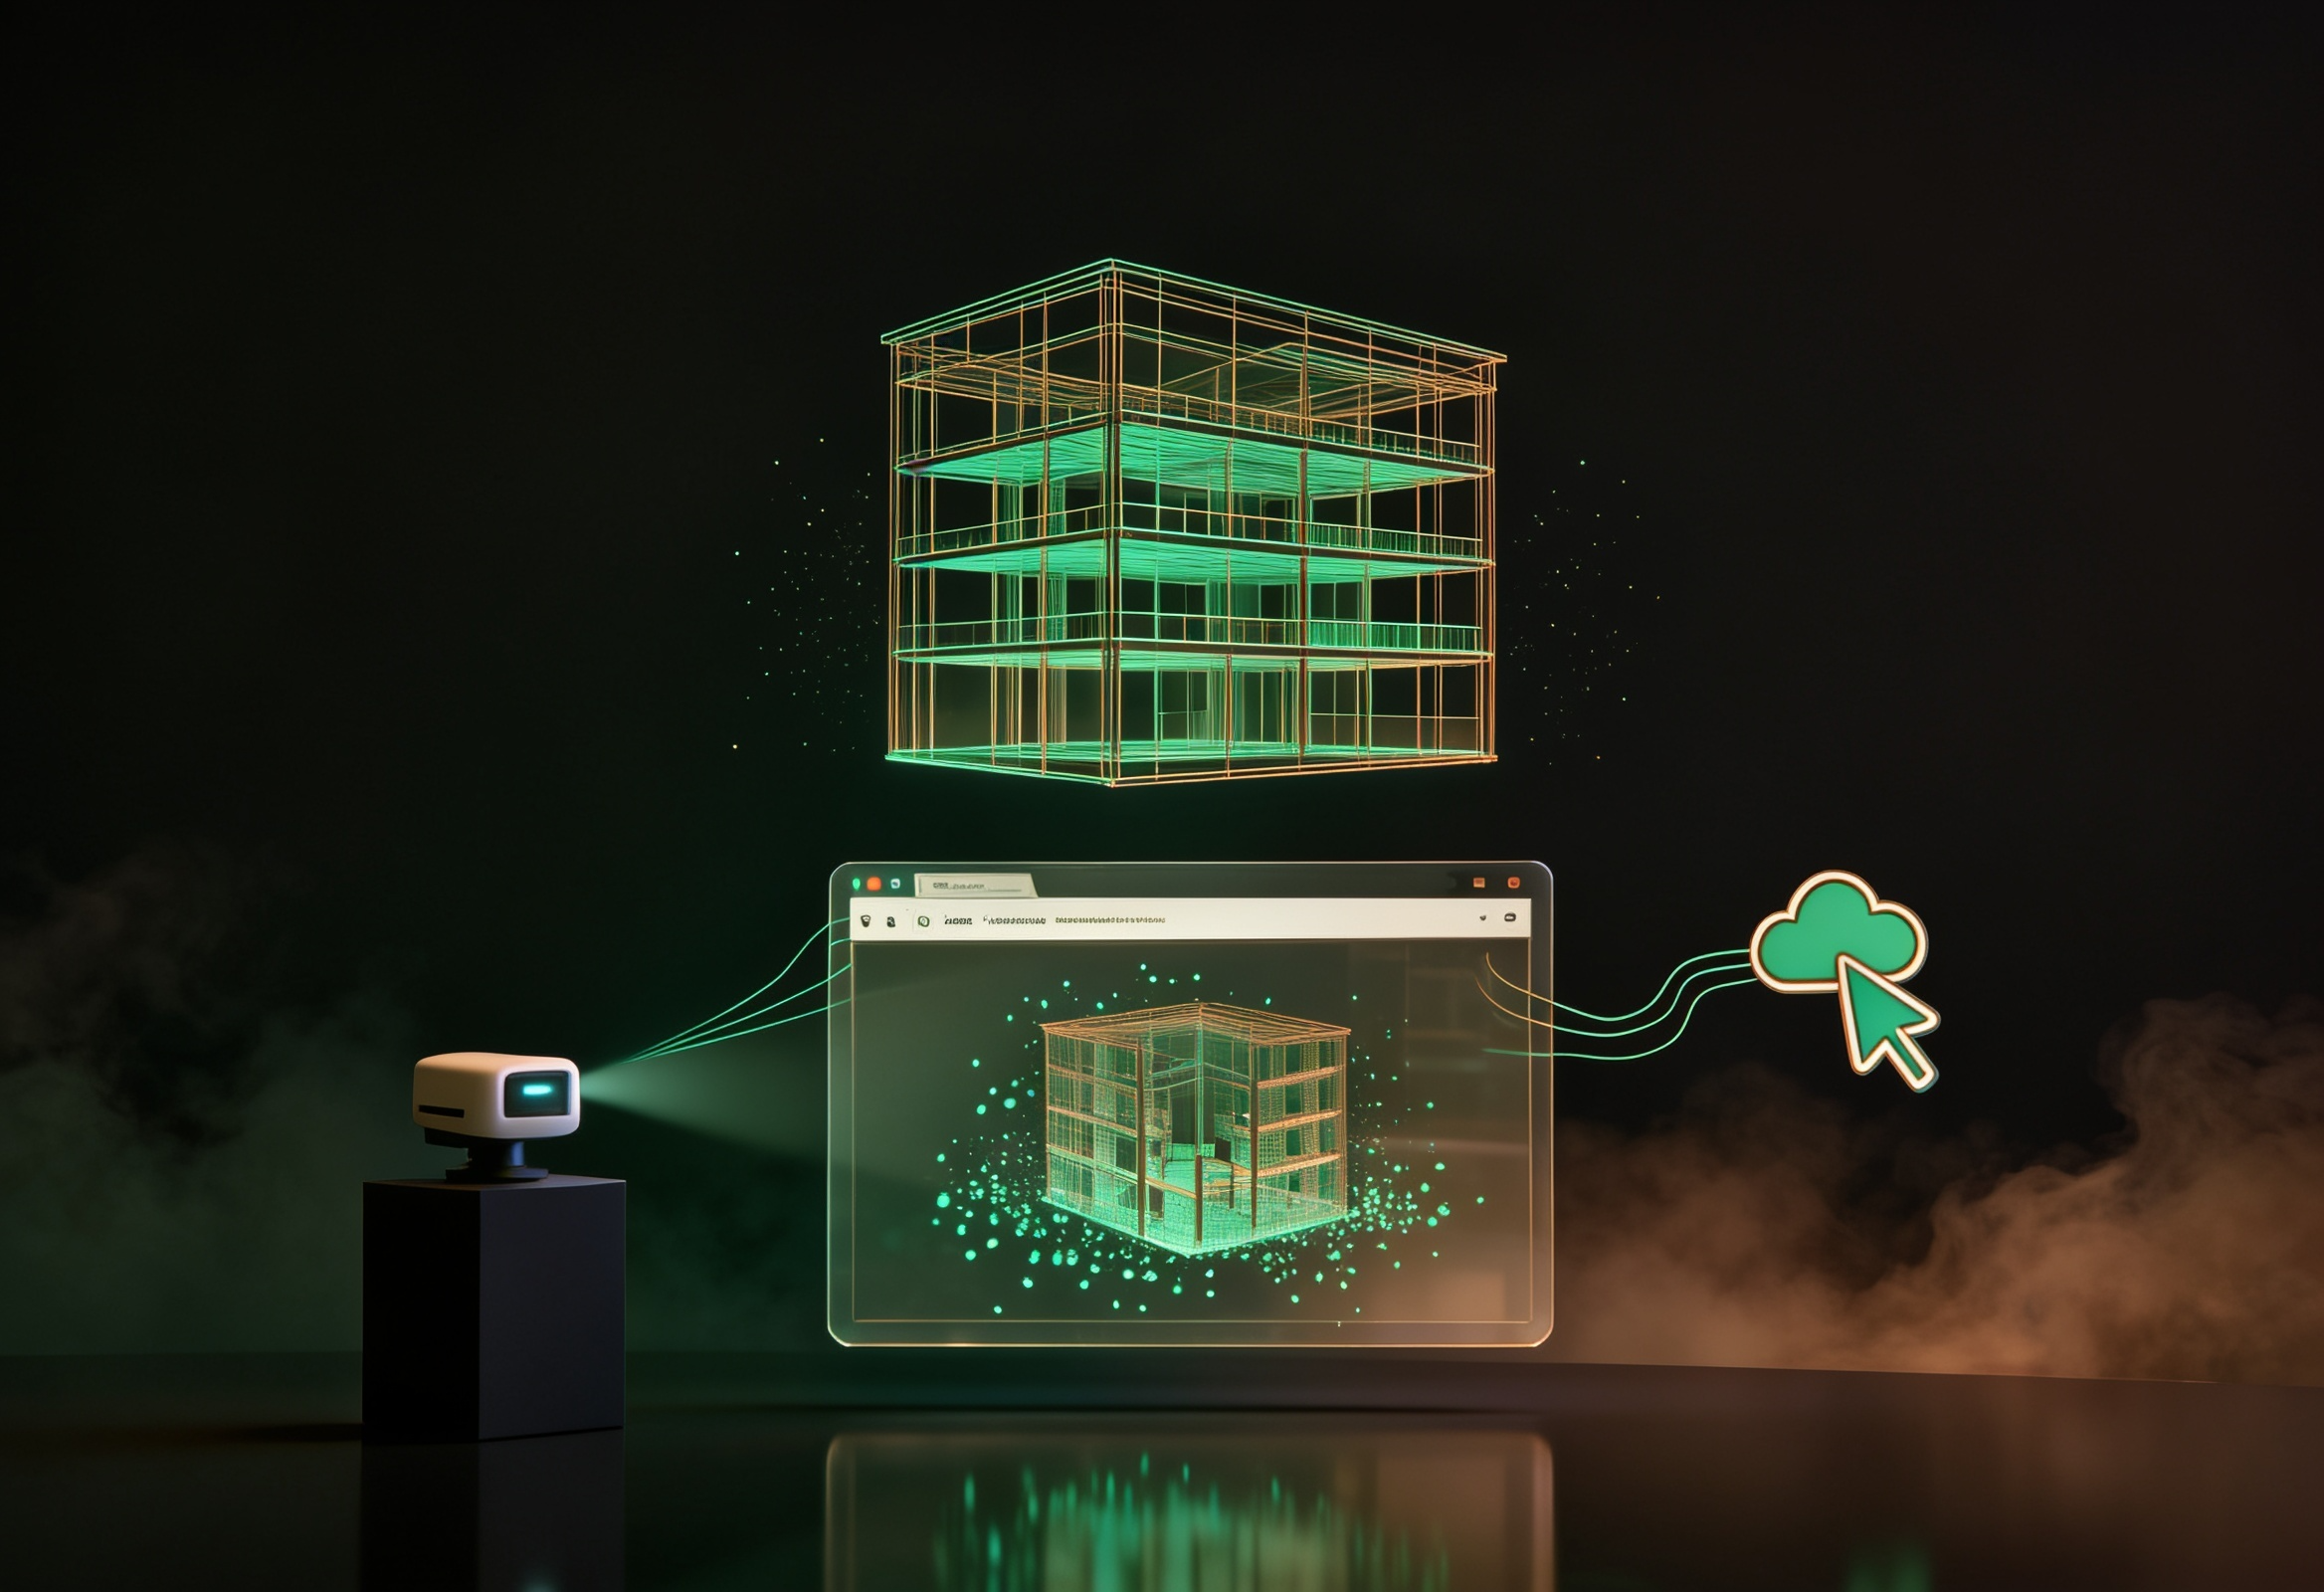
A US construction tech startup needed engineering capacity across the full stack of its SaaS + IoT digital twin platform: the browser-based 3D viewer, a cloud pipeline for large point cloud datasets, backend microservices, real-time collaboration, and AWS infrastructure, all working as one coherent product. Three different 3D rendering problems had to coexist in one interface, raw scan data had to be processed reliably at scale in the cloud, and infrastructure had to move from manually managed VMs to a reproducible, automated setup without disrupting active users.

Our Approach

Azati provided 24 months of full-cycle engineering, contributing to every layer of the product: a 3D viewer built with Autodesk APS Viewer SDK, Potree, and Three.js; an AWS Batch and SQS-based cloud processing pipeline; NestJS and Python microservices; custom AI models for face blurring and point cloud-to-blueprint conversion; WebSocket/SSE-based real-time collaboration; and a full migration to Terraform-managed AWS infrastructure. The result was a working scan-to-view workflow: scan a building, process the data in the cloud, view and collaborate on the digital twin in a browser.

Applied Methods and Practices

  • Multi-engine 3D viewer: Combined Autodesk Forge/APS Viewer SDK, Potree, and Three.js in a single browser-based interface for structured models, point clouds, and custom geometry.
  • Cloud processing pipeline: AWS Batch and SQS orchestrating parallel processing of large 3D scan datasets, with S3 storage and CloudWatch telemetry.
  • AI/ML components: Custom face blurring model for scan privacy and a point cloud-to-2D blueprint conversion model integrated into the pipeline.
  • Real-time collaboration: WebSocket and SSE-based updates with Slack and Discord integrations for multi-user, multi-stakeholder viewing.
  • Infrastructure-as-code migration: Terraform-managed AWS environment (VPC, ECS, S3, SQS, Redis), replacing manually managed virtual machines via cloud-init and Ansible.

Solution Features

  • Working scan-to-view workflow: Full pipeline delivered end to end, from the physical scanning device through cloud processing to a browser-based 3D digital twin.
  • Real-time multi-stakeholder collaboration: Construction teams, property assessors, and insurers work inside the same building model simultaneously.
  • Reproducible cloud infrastructure: Migration from manual VMs to Terraform-managed AWS established a maintainable, scalable infrastructure foundation.
  • Domain expertise built in-house: Deep experience in scan-to-view pipelines, 3D SDK extension, and hardware-connected SaaS development.
PEFS Digitization and DEXPI Conversion for Process Engineering Archives
Energy, Oil & Gas

PEFS Digitization and DEXPI Conversion for Process Engineering Archives

35,000 PEFS files in the archive, previously unsearchable
60–80% estimated reduction in manual work based on pilot results
DEXPI industry standard adopted for all converted output, enabling downstream system integration
  • Python
  • PyTorch
  • OpenCV
  • FastAPI
  • MongoDB

⚡ Pain Points We Tackled

A large Middle Eastern oil and gas operator held 35,000 Process Engineering Flow Scheme files across AutoCAD, PDF, TIFF, and JPEG formats, with no way to search them by equipment or process element. Every question about plant topology required manual review across the entire archive, and each format required a fundamentally different extraction approach, from vector parsing to computer vision-based symbol detection, while producing valid DEXPI output demanded precise process topology modeling rather than simple field mapping.

Our Approach

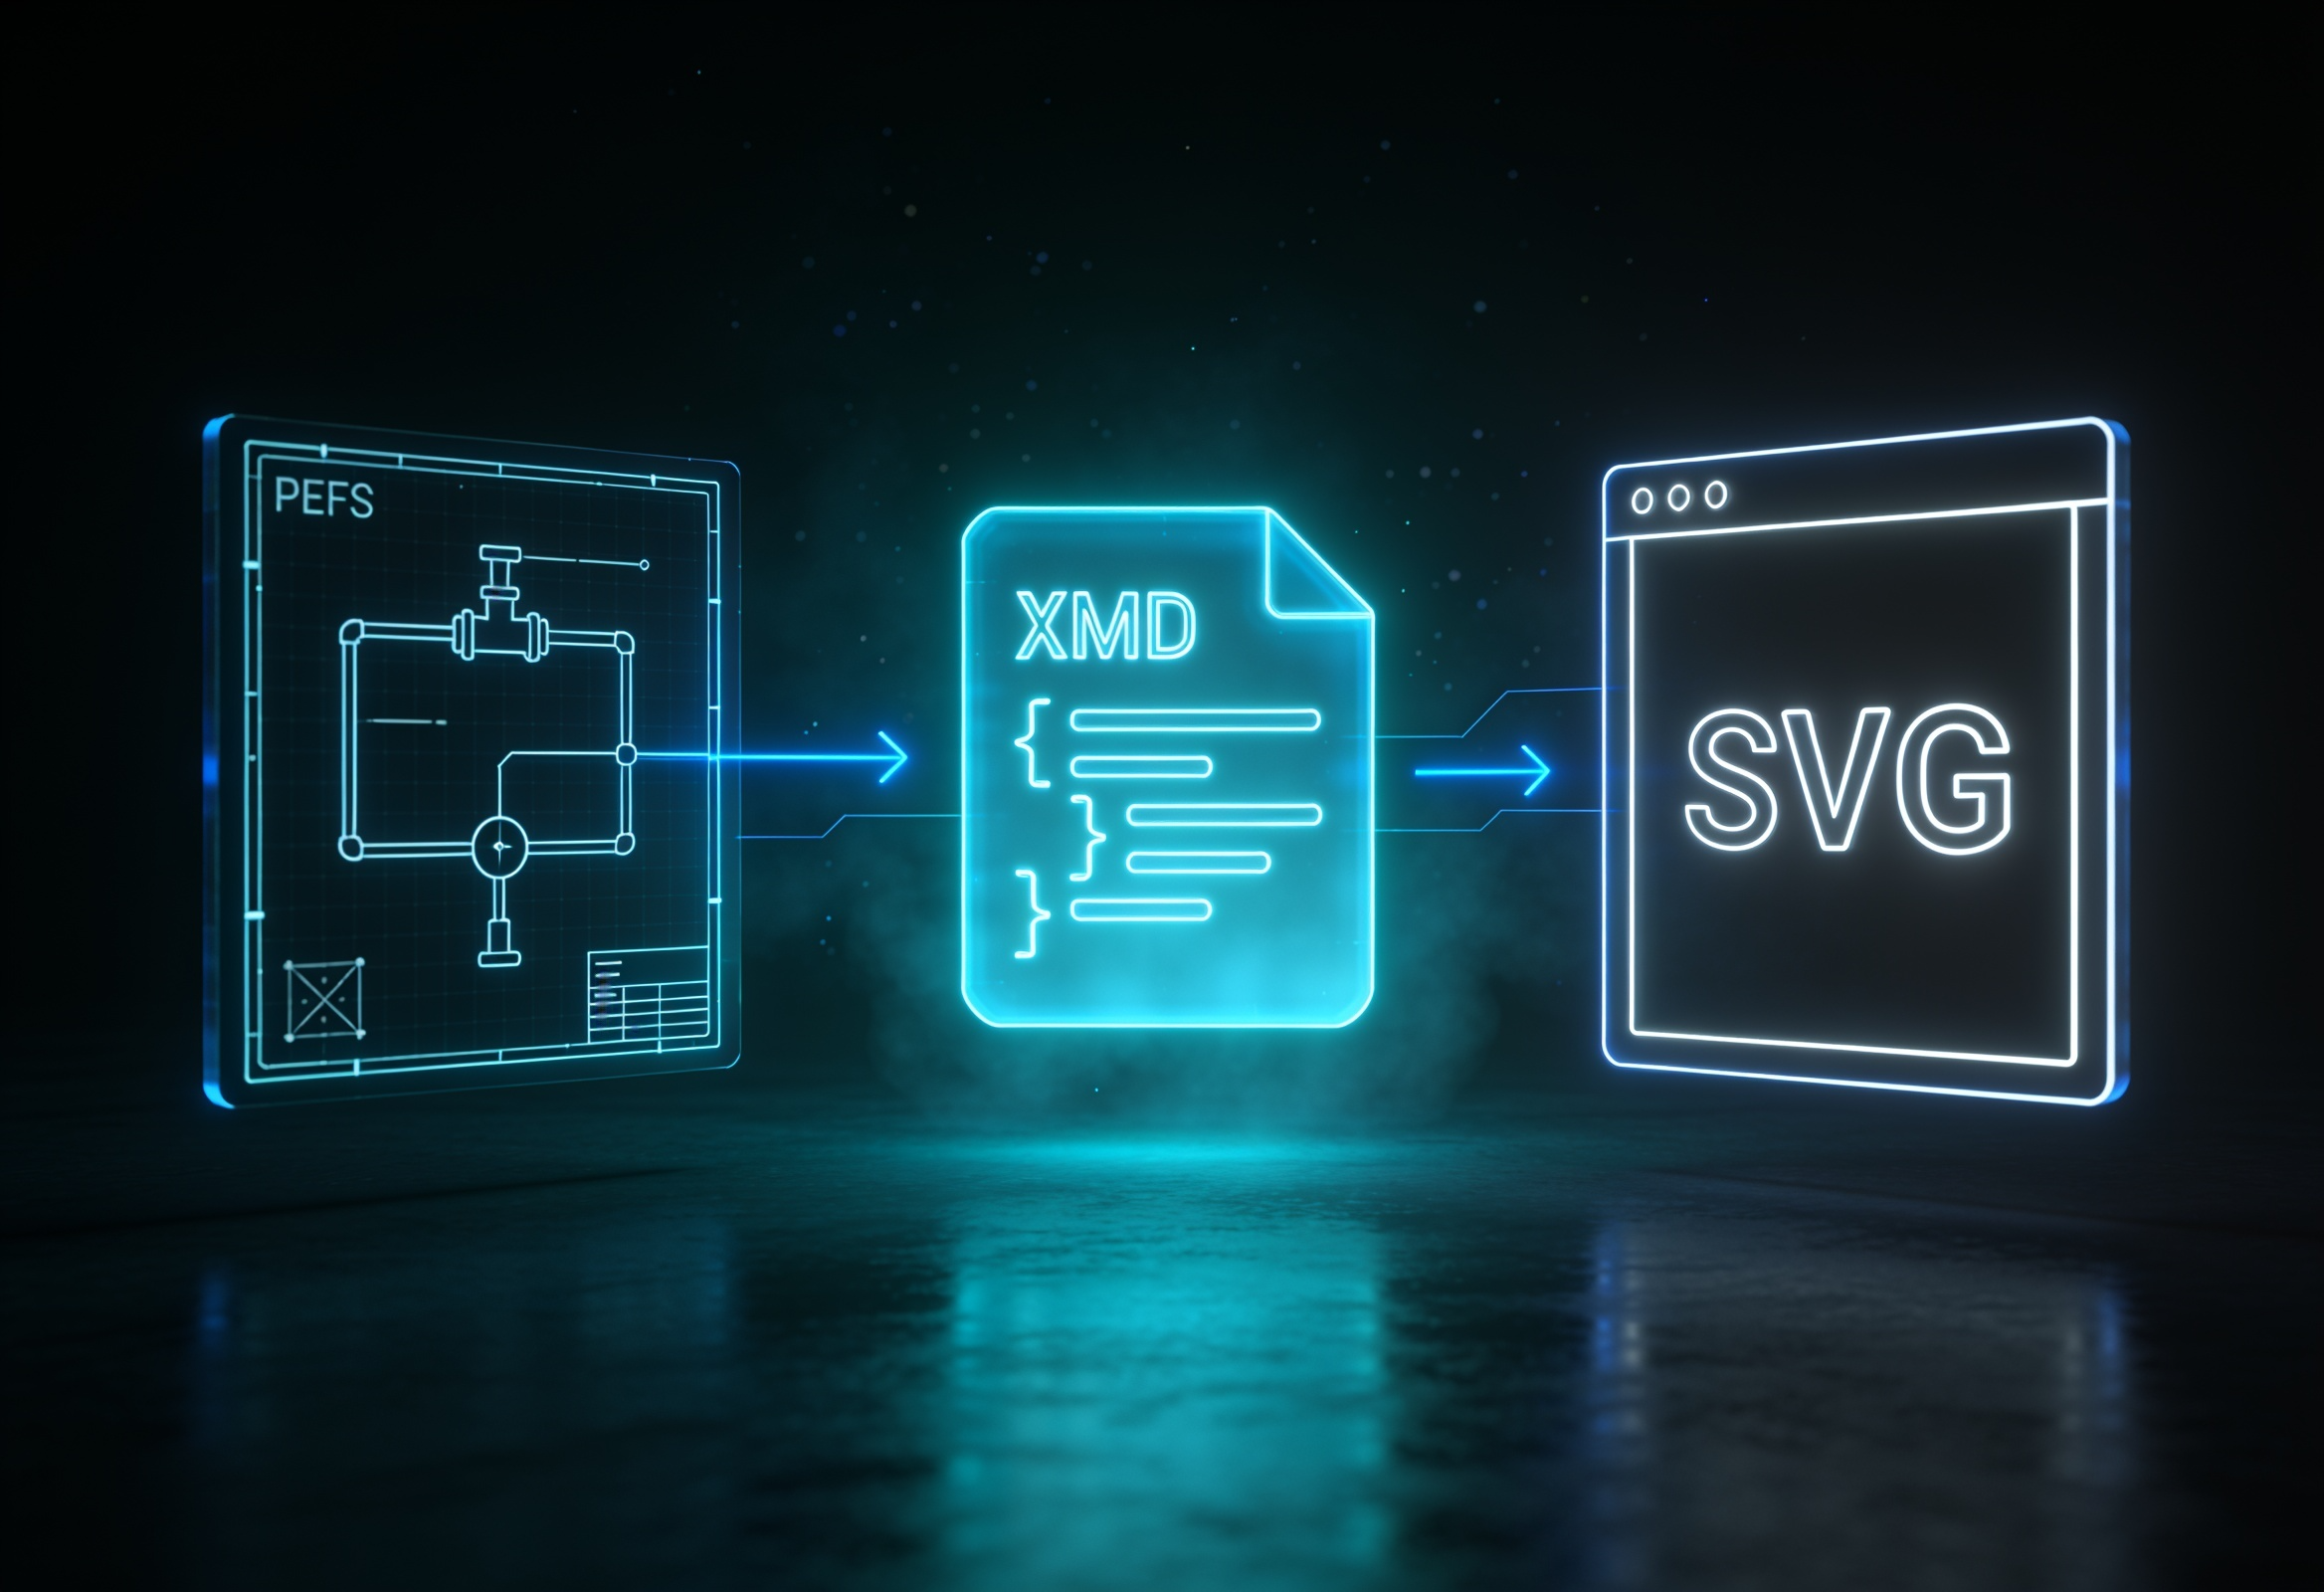
Azati built a multi-stage AI pipeline that ingests PEFS files in any format, detects and classifies equipment symbols, extracts and binds text to graphical elements, reconstructs process topology as a graph model, converts the result to the DEXPI industry standard via Proteus XML, validates it against the schema, and generates SVG visualizations for human review. The engagement started as a pilot and moved to full scale after the approach proved out, with models retrained iteratively as new drawing types surfaced.

Applied Methods and Practices

  • Multi-format drawing ingestion: AutoCAD DXF/DWG vector parsing via ezdxf alongside PDF, TIFF, and JPEG raster processing through a format-agnostic pipeline.
  • Symbol detection and classification: Object detection models trained on PEFS symbol libraries, retrained iteratively as new drawing conventions appear.
  • OCR and text-to-symbol binding: Equipment tags and instrument codes extracted and bound to graphical symbols for searchable metadata.
  • Process topology reconstruction: Geometric relationship analysis via Shapely and connection graph modeling via NetworkX.
  • DEXPI conversion via Proteus XML: pyDEXPI-based conversion with Pydantic validation enforcing schema compliance at every step.
  • SVG visualization and review layer: Scalable vector rendering with extraction overlays feeding back into model retraining.

Solution Features

  • 35,000 drawings made queryable: Engineers can now search the archive by tag, element, or process relationship instead of manual file review.
  • 60–80% reduction in manual processing: Pilot results showed automated extraction and conversion shifting the bulk of work from manual to AI-assisted.
  • DEXPI-compliant, integration-ready output: Converted files plug directly into engineering platforms, CMMS, and ERP systems without added transformation work.
  • Foundation for digital twin readiness: Machine-readable plant topology data enabling downstream digital twin and predictive maintenance initiatives.
AI-Powered Technical Document Processing and Defect Detection for Oil & Gas
Energy, Oil & Gas

AI-Powered Technical Document Processing and Defect Detection for Oil & Gas

~100,000 technical documents processed by the AI pipeline
50–70% estimated reduction in manual review effort
40–60% estimated reduction in reporting data preparation time
  • Python
  • FastAPI
  • PyTorch
  • OpenCV
  • OCI

⚡ Pain Points We Tackled

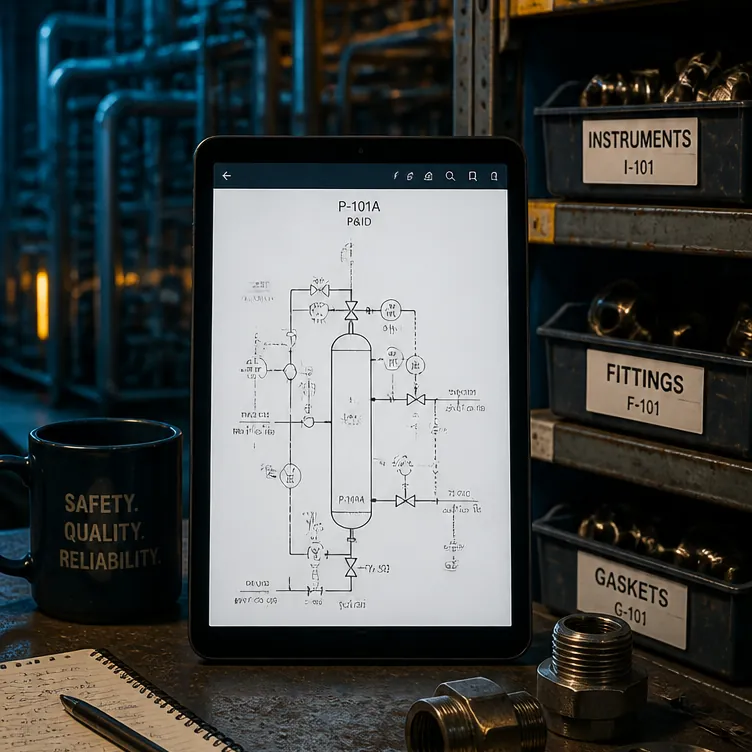
A large Middle Eastern oil and gas operator was manually extracting data from technical documents and engineering drawings submitted by contractors, cross-checking it against internal systems, and compiling reports by hand. At scale, this process was slow, resource-intensive, and increasingly error-prone, with no systematic way to prioritize which discrepancies mattered most.

Our Approach

Azati built an AI-powered pipeline combining computer vision and OCR to extract and validate data from engineering documents and AutoCAD drawings, flagging discrepancies against internal system records and delivering verified results directly into the client's existing Knowledge Hub platform, extending it rather than replacing it.

Applied Methods and Practices

  • Document and drawing data extraction: Computer vision and geometry-aware OCR pipeline handling AutoCAD, PDF, and raster formats.
  • Cross-validation against internal systems: Automated comparison against internal records with traceable discrepancy flagging.
  • LLM-assisted interpretation: Large language models providing context-aware interpretation of technical terminology across contractor document formats.
  • Knowledge Hub integration: Results delivered directly into the client's existing platform without a separate tool.
  • DD Projects and Reporting Hub: Tag hierarchies, bulk updates via Excel, and exportable reports with kh-link references back to source documents.

Solution Features

  • ~100,000 documents processed in production: Pipeline moved from pilot to full scale, validating the approach at real engineering document volumes.
  • 50–70% reduction in manual review effort: Automated extraction and discrepancy detection shifted most work from fully manual to semi-automated.
  • Faster reporting data preparation: Time spent preparing audit-ready data dropped substantially compared to the fully manual process.
  • Scalable, traceable process: Every extracted data point and flagged discrepancy traceable back to its source document.

Last updated

Got a job for Azati? Let’s talk business!

This site is protected by reCAPTCHA and the Google Privacy Policy and Terms of Service apply.

What's next?

  • 1. Tell Us Your Story
    Describe your project. We come back within 24 hours with team availability and a rough plan. NDA on request before the first call.
  • 2. Get Your Roadmap
    Receive a detailed proposal with scope, team composition, timeline, and costs tailored to your goals.
  • 3. Start Building
    Azati aligns on details, finalize terms, and launch your project with full transparency.