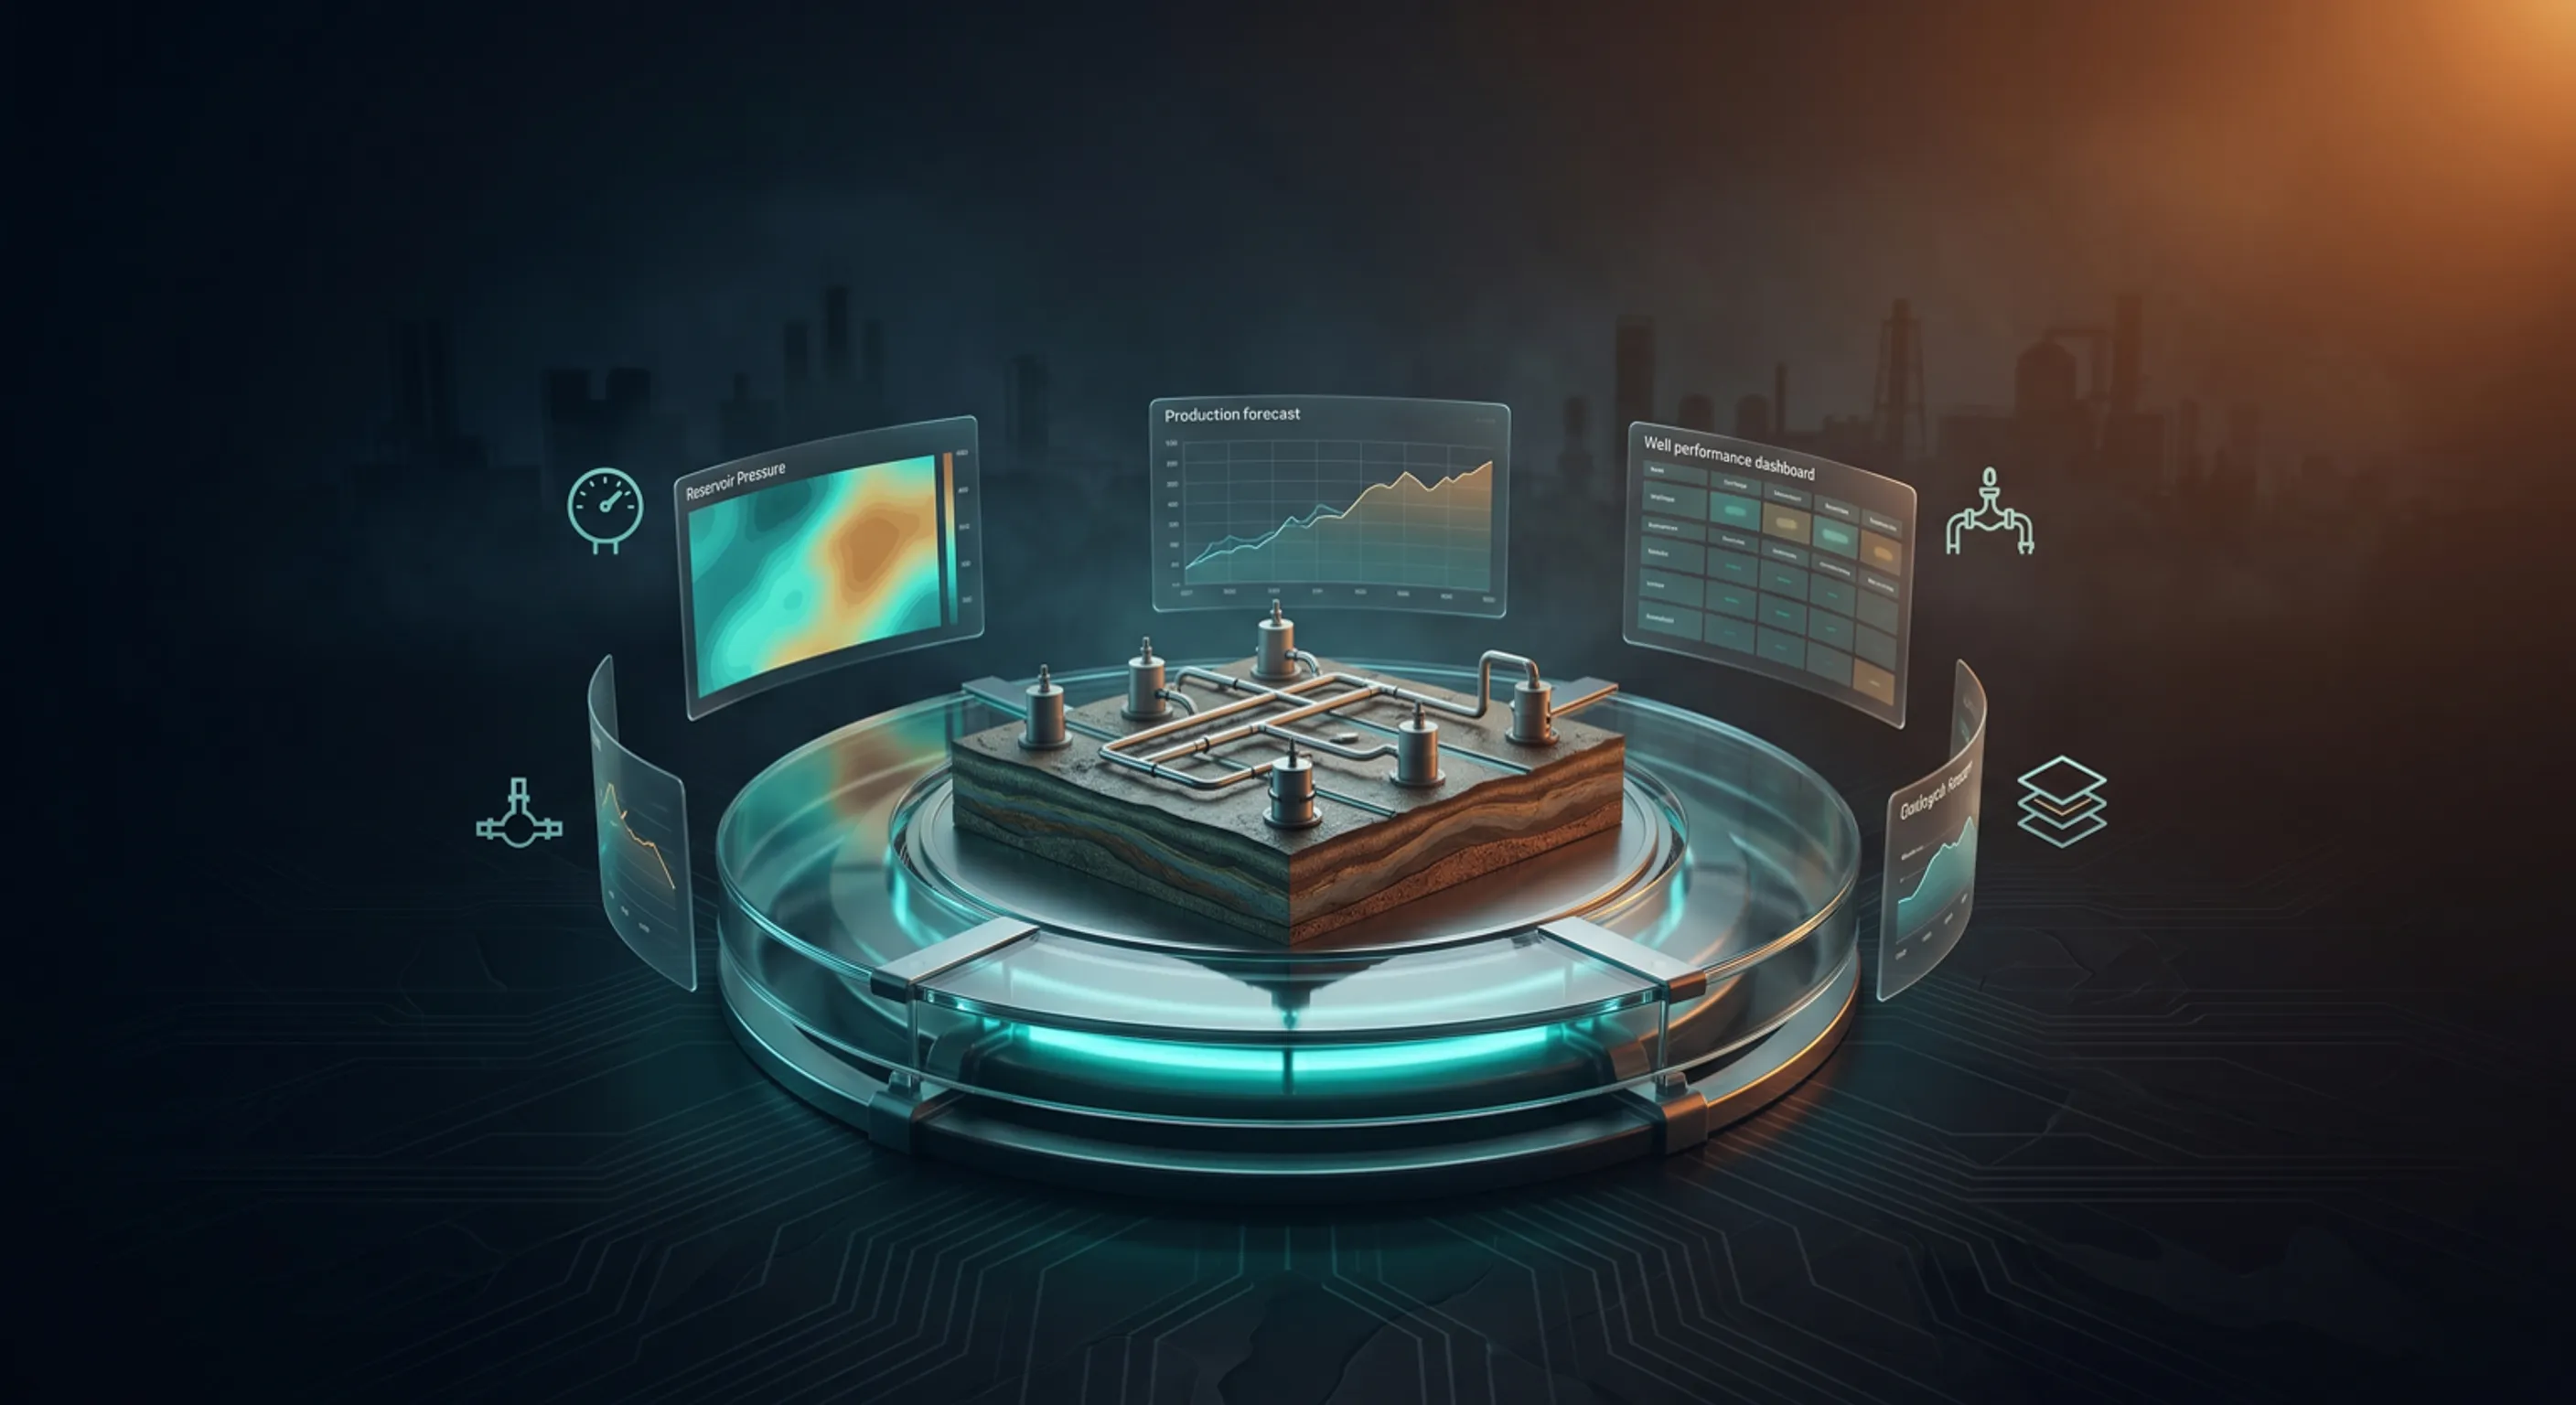
Predictive Analytics Built to Decide, Not Just Report

A forecast nobody acts on is just another chart. Azati builds forecasting, customer segmentation, and business intelligence solutions on data we’ve checked first to place the output where decisions get made: a lease review, a reorder point, a campaign plan, a production schedule, or a maintenance plan.

We connect data engineering, statistical modeling, and analytics delivery so teams can evaluate likely outcomes, understand the factors behind them, and use the results in business planning.

10 weeks
From kickoff to a deployed two-model retail forecasting calculator
100+
Audience segmentation dimensions across 30+ data sources
0 to 25+
Analysts now using the rebuilt analytics copilot. The prototype it replaced had no users
10 days
To redesign an oil & gas calculation core after QA found results exceeding physical limits by 8–12× before launch. Acceptance testing passed on the first attempt

Key takeaways

  • Forecasting is useful when its output is connected to a recurring business decision, such as expansion, replenishment, or production planning.
  • Model performance needs to be measured against a baseline. Without a reference point, an accuracy metric cannot establish improvement.
  • Decision-makers need to understand the factors behind a prediction and have a way to challenge or validate the result.
  • Analytical models must be tested against the business rules and physical constraints that apply in real operating conditions.
  • Adoption depends on whether analytical outputs fit existing workflows and whether users can verify the answers.

What are data science services?

Data science services use statistics and machine learning to analyze business data, explain patterns, and predict likely outcomes. Typical outputs include revenue and demand forecasts, customer segments, risk estimates, decision-support models, and dashboards that help people act on the findings.

At Azati, data science is part of our data engineering practice. We assess the data behind a model, develop the analytical approach, validate the results, and integrate the output into the workflow where it will be used. If the data is incomplete or unreliable, we address that limitation before presenting a model as decision-ready.

Data science, BI and predictive analytics: what’s the difference?

These disciplines answer different questions, but useful business solutions often combine them.

Comparison of business intelligence, predictive analytics, data science and decision support
Capability Business question Typical output
Business intelligence (BI) What happened, and where? Dashboards, reports, KPI monitoring and self-service analytics
Predictive analytics What is likely to happen next? Revenue, demand, inventory and risk forecasts
Data science Why is it happening, and what drives the outcome? Statistical analysis, segments, driver analysis and predictive models
Decision support What action should we consider? Prioritization, probability scores, planning recommendations and operational signals

A dashboard may show that demand is changing. A forecasting model estimates what comes next. Driver analysis explains the forecast, while a decision-support tool brings the result into the planning process. The objective is to better inform existing business decisions.

What does Azati build?

Azati develops BI, reporting, and predictive analytics solutions around defined business needs. The scope may range from a targeted forecasting tool to an analytical application built on a wider enterprise data platform.

Forecasting for revenue, demand, and operations

Forecasting models estimate future outcomes from historical data and relevant business drivers. Depending on the use case, results can include a point estimate, a prediction range, or a probability score that helps decision-makers understand uncertainty.

Typical applications include:

  • Revenue forecasting for new locations: estimate potential performance before committing to a lease or expansion.
  • Inventory and demand planning: forecast demand at product or SKU level and provide signals that can inform replenishment decisions.
  • Event and product planning: estimate likely demand to support capacity, inventory, and resource allocation.
  • Industrial and energy analytics: model production-related variables, including gas-oil ratio, to support technical and operational decisions.

The appropriate method depends on the data, forecast horizon, business constraints, and cost of an incorrect prediction. We evaluate model performance against held-out data and establish a baseline before claiming an improvement over an existing process.

What makes analytics reliable and usable?

A baseline makes model performance measurable

An accuracy figure has limited business meaning without a reference point. We establish what the existing process can measure, define a suitable baseline, and distinguish model performance from proven business improvement. See the retail forecasting case study for an example.

Explanations help users review predictions

Showing the factors that contribute to a result gives decision-makers a basis for questioning and validating it. Explanations support review, but do not independently prove accuracy or causation.

Validation must reflect real operating conditions

Testing should include the business rules, edge cases, and physical constraints that apply to the intended use. A model or calculation that works on typical inputs may still produce implausible results under less common conditions. See the reservoir analytics case study for an example.

Analytical tools need to fit the way people work

A model or interface is unlikely to be useful if users cannot verify its output or incorporate it into their existing process. Adoption depends on reliable data access, relevant business definitions, and a clear way to check results. See the analytics copilot case study for an example.

Statistical and scientific analytics

Some decisions depend on statistical analysis or calculations grounded in scientific and physical relationships rather than conventional business reporting.

Azati has worked on analytical solutions for complex insurance data, including reserve estimation, and on reservoir analytics where calculations inform decisions about physical extraction processes.

These use cases require domain-specific validation. A result can be computationally plausible yet operationally wrong if the model violates the assumptions or constraints of the underlying system.

What have we learned from building forecasts people use?

A forecast needs a baseline before it can prove an improvement

In a retail forecasting engagement, the client had not previously measured the accuracy of its own expert forecasts for store-opening decisions.

The measured figure established a baseline for the model. It did not prove that the model outperformed the client’s previous process. The next step was business validation during a test period.

Explanations help decision-makers assess a prediction

A forecast is more useful when users can investigate why it changed. In the retail forecasting calculator, each forecast included a breakdown of its 15 leading drivers and the direction in which they influenced the result.

This gave development managers a way to question and validate the model’s reasoning rather than treating the prediction as an unexplained output.

The right explanation method depends on the model and use case. Explanations can support review, but they do not by themselves establish that a prediction is correct or that a factor causes the outcome.

Business and physical constraints belong in validation

On an oil and gas reservoir analytics project, QA identified calculation coefficients exceeding physical limits by 8–12 times under extreme salinity conditions. Azati redesigned the computational core in 10 days, maintained the delivery date, and passed user acceptance testing on the first attempt.

The lesson applies beyond industrial modeling: test data and edge cases can reveal failures that a successful demonstration does not. Validation needs to reflect the conditions under which a model or calculation will actually be used.

Analytics adoption depends on whether answers can be checked

An earlier AI-built analytics prototype at a retail client had no users. Its search failed when questions were phrased differently, and analysts could not reliably check its answers against actual data.

The broader principle is simple: analytical tools need to fit the way people work, and users need a way to verify the results.

Who is this for?

Azati works with midmarket and enterprise organizations that already collect business or operational data but need to use it more effectively for forecasting, analysis, and planning.

The strongest fit is typically:

Retail and e-commerce

Commercial, finance, and development teams evaluating new locations, forecasting revenue, or improving demand and inventory planning.

Media and telecom

Analytics and marketing teams combining audience data, investigating engagement, and enabling self-service reporting.

Energy and oil & gas

Operations and engineering teams using production forecasts and analytical calculations that must reflect physical constraints.

Typical stakeholders include:

CFOs and commercial directors

Need more reliable forecasts for investment, expansion, and resource-allocation decisions.

Heads of analytics
and BI

Teams are constrained by fragmented reporting, manual analysis, or underused analytical tools.

Operations and engineering directors

Need models and calculations validated against operational conditions.

CIOs and data leaders

Responsible for making existing data platforms more useful to business teams.

When should a business invest in predictive analytics?

Predictive analytics becomes relevant when historical reporting is no longer sufficient for the decisions a business needs to make.

Common signals include:

  • Expansion, inventory, or production decisions still depend heavily on manual estimates or individual expertise.
  • Business teams have historical data but cannot produce forecasts at the level of detail required for planning.
  • Different departments report conflicting figures because they use different source systems or metric definitions.
  • An existing analytics or AI prototype has not gained adoption because users cannot verify its results or fit it into their workflow.
  • Operational calculations need more rigorous validation against business rules, technical assumptions, or physical limits.
  • The organization wants to introduce forecasting or decision-support capabilities without replacing its existing data platform.

The right starting point is to define the decision, assess the data available, and establish how the result will be evaluated. Not every problem requires a complex machine learning model; in some cases, better data preparation, statistical analysis, or a simpler forecasting method is more appropriate.

How does an analytics project run?

We start with the business decision, not a preferred algorithm. That keeps the project focused on a result that can be evaluated and used.

Actual delivery time depends on data readiness, scope, access, and validation requirements. The retail forecasting example above illustrates a focused engagement from kickoff through deployment.

  1. Define the decision

    We identify the decision the solution should support, who makes it, and how often it occurs. This determines the relevant forecast horizon, required level of detail, and acceptable consequences of error.

  2. Assess the data

    We examine source availability, quality, history depth, gaps, consistency, and potential data leakage. If the data foundation is not ready, we identify what needs to be fixed before modeling.

  3. Establish a baseline

    We measure the current process where possible. If the business has never measured its existing approach, we make that limitation explicit and define an initial reference point.

  4. Develop and validate the model

    We compare suitable statistical or machine learning approaches using held-out data. Depending on the use case, validation may include forecast error, classification trade-offs, driver explanations, edge cases, and business constraints.

  5. Put the output into the workflow

    We deliver the result through an analytical application, calculator, dashboard, API, or operational signal, not just a notebook or a presentation.

  6. Evaluate real-world performance

    We agree on a test period and assess how the solution performs against observed outcomes. If the model is intended to remain in use, we also define how accuracy, changing patterns, and maintenance responsibilities will be handled.

How engagements are scoped

Focused engagement

Proof of concept

A focused engagement built around one defined business decision and a limited analytical scope. It establishes data suitability, tests the selected approach, and delivers an output that can be evaluated by the intended users.

Broader solution

Full analytical application

A broader solution combining forecasting, segmentation, BI, or decision support with the data integration and application components needed for business use. Delivery can be phased around business priorities.

Long-term partnership

Ongoing analytics partnership

Continued evaluation and improvement of analytical solutions, with monitoring, retraining, and maintenance responsibilities agreed according to the solution’s operational requirements.

Ready for forecasting or need a data pipeline cleanup first?

You’re ready if: your decision data sits in a structured environment (for example, PostgreSQL or Greenplum) and the history is long enough for the pattern you need to model. For seasonal demand, 12–24 months is a useful starting point; we assess sufficiency case by case.

You need data readiness if: your department metrics conflict across systems, data is trapped in unstructured silos, or historical records have major gaps.

Check whether your data is ready

What does the data readiness assessment cover?

Before developing a model, Azati assesses whether the available data can support the business decision you want to improve.

The assessment examines source availability, historical coverage, data gaps, consistency, and potential data leakage. It also considers how the existing decision process can be measured and what validation would be required.

You receive a view of the data’s suitability for the proposed use case, the limitations that may affect the results, and the recommended next steps. Where the data is not ready, the assessment identifies what should be addressed before model development begins.

What we at Azati do, and what we don’t

Azati does:

  • Build forecasts, segments and dashboards on data we have assessed.
  • Report model performance on held-out data and explain the relevant trade-offs.
  • Make assumptions, data limitations and validation requirements visible.
  • Integrate analytical outputs into business workflows.
  • Work within closed client environments when data and credentials must remain under the client’s control.
  • Define post-launch monitoring and maintenance responsibilities as part of the solution.

Azati doesn’t:

  • Promise a specific accuracy level before assessing the data and use case.
  • Present proof-of-concept metrics as proven business savings or operational improvements.
  • Assume that more complex models will outperform simpler approaches.
  • Treat a dashboard or a model as a substitute for data governance and reliable source systems.
  • Claim that a model will remain accurate without monitoring against new data and observed outcomes.

If the data is not ready, we will say so. In some projects, improving the data pipeline or clarifying business definitions is the right first step.

What do predictive analytics and forecasting look like in practice?

ML-Powered Revenue Forecasting for New Retail Locations
Commerce & Logistics

How to forecast revenue and assess risk for new retail locations

30.1% WAPE on the new-store revenue prediction model's holdout fold
69.7% / 82.8% weak-store recall and protection of strong stores from false flags
10 weeks from kickoff to a working two-circuit calculator, including two scope changes
  • Python
  • XGBoost
  • LightGBM
  • Scikit-learn
  • Optuna
  • Flask
  • PostgreSQL

Business challenge

A large grocery retail chain was making new-store investment decisions primarily through expert judgment, without a measurable baseline for forecast accuracy. With 50–100 new locations planned across its core metro region, the risks were significant: 21% of new stores closed as unprofitable in 2025, while another 16% were operating at a loss. Azati was tasked with developing a machine learning calculator to estimate average monthly revenue for prospective locations, helping development managers make more informed decisions before signing a lease.

Solution at a glance

Azati developed a web-based, two-circuit ML calculator combining a revenue regression model with a weak-store classifier. Using location coordinates, store area, and internal store-cluster information, the system estimates average monthly revenue, provides a prediction interval, and assesses the probability of a location underperforming. SHAP-based explanations show the main predictors behind each forecast.

How Azati solved the challenge

  • Developing a regression model for new-store revenue: Because revenue is a continuous value rather than a category, Azati built a regression-based prediction approach using XGBoost and LightGBM. The model estimates average monthly revenue from three inputs: map coordinates, store area, and the location's internal store cluster. Alongside the point estimate, it provides a q20–q80 quartile interval to communicate forecast uncertainty.
  • Adding a classifier to identify underperforming locations: When the client's requirements shifted during development, the project expanded beyond revenue forecasting. Azati introduced a second, independent modeling circuit: a two-head probabilistic classifier designed to flag locations at risk of underperformance. Its staircase decision rule balances the detection of weak stores against the risk of incorrectly flagging strong ones.
  • Making individual forecasts explainable: Azati integrated SHAP-based analysis to show the top 15 predictors contributing to each location's forecast. This gives development managers visibility into the factors behind an individual prediction rather than presenting an unexplained revenue figure. Boruta-based feature selection supports the final predictor set.
  • Building a usable forecasting calculator: The models were integrated into a web application built with Flask and served through Gunicorn. A Folium-based map interface supports location input, while managed PostgreSQL stores prediction inputs, results, and forecast points. Hyperparameters across both modeling circuits were tuned using Optuna.
  • Adapting to changing requirements within the original timeline: The initial brief called for a single revenue prediction model. During development, the client introduced a second requirement: identifying potentially weak locations. Azati added the independent classification circuit without restarting the project or extending its original 10-week delivery window. One ML engineer owned the work end to end, using Claude Code as a development agent throughout.

Business outcomes

  • 30.1% WAPE on the revenue model's holdout fold, establishing the client's first measured baseline for new-store revenue forecasting.
  • 69.7% recall on weak stores, while correctly leaving 82.8% of strong stores unflagged.
  • More transparent forecasts, with location-specific explanations showing the top 15 predictors behind each prediction.
  • A working two-circuit calculator delivered in 10 weeks, despite two changes to the project scope.
  • Persistent forecast records stored in PostgreSQL, providing a queryable history of prediction runs.

Validation and business impact

The client is conducting a three-month test period to compare calculator-assisted store-opening decisions with its previous expert-judgment approach. The business impact has not yet been quantified. The reported model metrics are technical evaluation results, not evidence of improved store profitability or reduced closure rates.

Oilfield Reservoir Analytics Platform
Energy, Oil & Gas

How do you cut calculation error 1000x before it ever reaches production?

4 analytical modules delivered in a 4-month window
~1000x reduction in floating-point accumulation error
10 days to redesign the computational core pre-launch – UAT passed first attempt
  • Python
  • JavaScript
  • React
  • PostgreSQL

Business challenge

A major oil and gas enterprise needed a petroleum analytics platform to calculate well interaction coefficients, target compensation, production rates and losses, reservoir pressure dependencies, and gas-oil ratio forecasts – processing high-volume production data across well coordinates, lithology, salinity, and historical production datasets. Requirements changed mid-sprint throughout the build, mathematical formulas needed constant validation, and because the calculations directly influence physical extraction decisions, precision and stability were non-negotiable.

Solution at a glance

Azati built a modular suite of Python-based calculation services, each independently deployable, covering well compensation, gas-oil ratio forecasting (with ML-assisted clustering and regression), and production rate calculation. Two weeks before launch, Azati's QA team caught a critical defect through property-based and stress testing on real historical geological data – impact coefficients were exceeding physical limits by 8–12x under extreme salinity conditions – and the engineering team redesigned the computational core in 10 days without slipping the delivery date.

How Azati solved the challenge

  • Modular Petroleum Calculation Engineering: independent, service-oriented Python modules for well interaction, compensation, and forecasting.
  • ML-Assisted Forecasting: clustering and piecewise linear regression for gas-oil ratio forecasting, replacing a heavier legacy methodology.
  • Property-Based & Stress QA: regression testing against real (not synthetic) historical geological datasets, including extreme edge cases.
  • Numerical Stability Engineering: Kahan summation and resource-isolation controls to eliminate floating-point drift and memory failures.

Business outcomes

  • Modular, Independently Deployable Services: each analytical module can be updated or recalculated without touching the rest of the platform.
  • Transparent Engineering Diagnostics: automated anomaly reports and system commentary explain why a calculation failed or what geological condition caused it.
  • Physically-Constrained Validation Safeguards: invariant checks and circuit breakers stop physically impossible outputs from ever reaching production.
  • CI/CD-Integrated Edge-Case Testing: geological edge cases became a mandatory quality gate in the deployment pipeline going forward.
BI and DWH Services for Telecommunication Provider
Telecom

How do you turn 80TB of daily data into real-time marketing decisions?

80TB+ data processed daily
100+ advanced audience-segmentation dimensions
30+ integrated data sources
  • Big Data
  • ETL
  • JavaScript
  • Machine Learning
  • Node.js
  • IBM Db2 Warehouse

Business challenge

A major entertainment company managing cable channels, streaming services, and digital platforms faced overwhelming data volume – terabytes daily from online and offline sources. They needed deep insight into audiences (age, gender, hobbies, social connections, behavior) and a way to optimize content release timing, ad-targeting, and audience retention that manual, historical-data analysis couldn't deliver.

Solution at a glance

Azati built a unified BI and data warehouse solution combining 30+ sources into a central platform, enabling advanced audience segmentation across 100+ attributes and fast, self-service access for marketing and analytics teams – streamlining content planning and ad-targeting across TV and digital platforms. Azati has run and extended this platform for the client since 2017.

How Azati solved the challenge

  • Big-Data Processing Workflows: automated extraction, transformation, and loading pipelines handling 80+ terabytes per day.
  • Machine-Learning Audience Segmentation: algorithms building precise demographic, behavioral, and interest-based segments.
  • BI Dashboards & OLAP Analytics: analysis of impressions, play rate, click-through rate, engagement, churn, acquisition, and retention.
  • Data Warehousing & ETL Optimization: centralized storage and optimized ETL for performance, scalability, and maintainability.

Business outcomes

  • Unified Audience-Planning Platform: integrates TV and digital campaigns for seamless targeting and campaign management.
  • Self-Service Analytics Dashboards: marketing teams query insights independently, without going through IT.
  • Rapid Access to Insights: centralized storage enables fast querying and reporting across every integrated source.
  • VOD Analytics & Optimization: tracks impressions, engagement, and churn to optimize content release timing and reach.
AI Analytics Copilot for Corporate Retail Analytics
Commerce & Logistics

How to build an AI analytics copilot your team can trust

25+ analysts using the copilot across multiple business domains
4 integrated components connecting retrieval, code assistance, SQL execution, and quality tracking
Zero to 25+ users following a rebuild of an unused prototype
  • Python
  • FastAPI
  • FastMCP
  • OpenAI API
  • LangFuse
  • GreenPlum
  • ClickHouse
  • MS SQL

Business challenge

A retail analytics team needed one system to search corporate knowledge by meaning, connect that knowledge to its Cursor code assistant, and verify analytical hypotheses against live data. Its previous AI-built prototype had no users: literal keyword matching failed across different terminology, responses were slow, and the absence of instrumentation made retrieval quality difficult to assess. The replacement also had to operate entirely within the client's proprietary infrastructure and existing data environment.

Solution at a glance

Azati rebuilt the prototype as an AI analytics copilot combining custom hybrid retrieval, an MCP server for Cursor integration, an SQL execution layer, and a benchmark repository. The system searches corporate analytics knowledge using both semantic meaning and exact terms, gives the code assistant access to the same knowledge base, and lets analysts and agents check hypotheses against the client's own data.

How Azati solved the challenge

  • Rebuilding retrieval around how analysts search: The original full-word search required users to know the exact wording used in a document. Azati replaced it with a custom hybrid retrieval approach combining Okapi BM25 keyword ranking and semantic embeddings. Purpose-built ranking models were tuned to the client's analytics data, balancing contextual relevance with precision for internal terminology, report names, metrics, and product identifiers.
  • Connecting corporate knowledge to Cursor through MCP: Azati developed an MCP server using FastMCP, connecting the analytics knowledge base directly to the client's Cursor-based code assistant. This allowed analysts and developers to access the same retrieval layer from their existing coding workflow without switching between separate tools.
  • Enabling hypothesis testing against live data: A dedicated SQL execution layer allows an agent to run queries inside the client's own data environment. Instead of relying solely on generated explanations, analysts can check hypotheses against actual query results within the same workflow.
  • Establishing measurable retrieval quality: Azati built a benchmark repository to track retrieval performance against a known baseline. Structured comparisons and analyst feedback support iterative tuning, helping the team assess whether changes improve search quality rather than relying on anecdotal impressions.
  • Reworking the architecture for ongoing development: The original prototype was broken down into microservices and modules, with retrieval prioritized before additional functionality. Azati introduced a staged improvement roadmap, adding SQL execution, analyst feedback mechanisms, and GitLab integration as the platform matured.

Business outcomes

  • 25+ analysts using the copilot across multiple business domains, compared with zero users on the previous prototype.
  • Context-aware knowledge retrieval replaced literal full-word matching, helping analysts find information even when their queries use different wording from the source documents.
  • Code-assisted access to corporate analytics knowledge through direct integration with the client's Cursor workflow.
  • Data-backed hypothesis testing through SQL execution inside the client's existing data environment.
  • Continuous retrieval quality improvement supported by a benchmark repository and analyst feedback.

Delivery model

One embedded ML Engineer / Backend Developer owned the rebuild end to end, covering retrieval architecture, MCP integration, SQL execution, benchmarking, and the project roadmap. The engagement has run on Kanban since March 2026 and remains ongoing.

Security and infrastructure

The platform runs entirely inside the client's proprietary infrastructure, with no external cloud dependency. SQL execution takes place within the client's own data environment and uses its existing access paths.

Enterprise Data Platform Modernization and Analytical Pipeline Development
Energy, Oil & Gas

How to improve access to trusted business data across multiple enterprise systems?

Dozens of analytical data marts and pipelines built and enhanced
Hundreds of flows within the enterprise data ecosystem
24+ months of continuous embedded delivery
  • Python
  • SQL
  • dbt
  • Apache Airflow
  • ClickHouse

Business challenge

A large chemical enterprise required scalable mechanisms to collect, transform, and deliver trusted analytical data across dozens of interconnected business systems. Growing analytical requirements, a complex data ecosystem with hundreds of flows and thousands of tables, and the need for reliable reporting data created ongoing engineering challenges.

Solution at a glance

Azati embedded specialists into the client's delivery organization, developing analytical pipelines, data marts, and orchestration workflows using SQL, Python, dbt, Apache Airflow, Apache NiFi, Greenplum, PostgreSQL, and ClickHouse. The engagement focused on continuous platform evolution over 24+ months rather than a one-time implementation.

How Azati solved the challenge

  • Data integration and ingestion workflows: Mechanisms for bringing data into the analytical environment from multiple enterprise systems.
  • Analytical data marts: Business-oriented datasets curated for reporting and self-service analytics.
  • Workflow orchestration: Apache Airflow and Apache NiFi-based pipelines for continuous data processing and delivery.
  • Performance optimization: SQL and transformation refinement as the analytical asset base expanded.
  • Scalable foundations: Greenplum, ClickHouse, dbt, and PostgreSQL supporting growing analytical requirements.

Business outcomes

  • Improved access to trusted business data: Curated analytical datasets simplified information consumption for BI teams.
  • Better operational visibility: Reliable analytical structures supporting reporting and operational analysis across multiple domains.
  • Sustainable platform evolution: Continuous enhancements accommodating changing reporting requirements and new systems over 24+ months.
  • Additional engineering capacity: Azati integrated into the client's established delivery organization without disrupting existing processes.

Which technologies do we use?

We select technologies based on the data environment, analytical requirements, delivery constraints, and the way the output will be used. The following tools have been used in Azati projects. The stack for a new engagement depends on its requirements.

Technologies Azati has used in delivered analytics projects, by layer
Layer Technologies used in delivered projects
Modeling and statistical analysis Python, pandas, NumPy, scikit-learn, XGBoost, LightGBM, Optuna, SHAP, Keras / TensorFlow, PyTorch
Time-series and statistical methods SARIMAX, piecewise and regularized regression, clustering
Data platforms and compute PostgreSQL, Greenplum, ClickHouse, Microsoft SQL Server, IBM Db2 Warehouse, Netezza, AWS Athena, AWS SageMaker
Application delivery Flask, FastAPI, Docker, web calculators and analytical applications
Business intelligence IBM Cognos, custom web dashboards

The technology list is evidence of experience, not a commitment to use every tool on every project. We assess the existing platform and integration constraints before recommending a stack.

How does this service fit with Azati’s other capabilities?

Analytics projects often overlap with data engineering and AI. The right starting point depends on the problem you need to solve.

  • The data is fragmented, unreliable, or not ready for AI

    Start with Data Engineering & AI Data Readiness. We assess and improve the pipelines, transformations, and analytical datasets needed for reliable downstream use.

  • You need machine learning inside a product or operational process

    Explore Generative AI & Advanced ML Engineering for use cases such as recommendations, anomaly detection, computer vision, NLP, and generative AI.

  • You need to operate and improve AI systems after launch

    Explore Managed AI & Process Re-engineering for ongoing monitoring, optimization, and operational support.

  • You need natural-language access to enterprise knowledge

    Explore Knowledge Intelligence for search and retrieval across business documents and other knowledge sources.

These capabilities can be combined where the project requires them. The scope should follow the business problem rather than expanding automatically into a larger AI initiative.

Which business decision needs better evidence?

Tell us which decision you need to support, who makes it, and where the relevant data lives. We’ll review the use case and outline the first steps, including whether your data can support the analysis.

Share the details of your decision

What do teams ask us about data science and forecasting?

Data science services can include forecasting, segmentation, statistical analysis, driver explanations, decision-support models, and the dashboards or applications that present the results. At Azati, we also assess the data foundation and integrate analytical outputs into the workflow where they will be used.

Business intelligence helps teams understand what has happened through reports, dashboards, and KPI analysis. Data science uses statistical methods and machine learning to investigate patterns, explain drivers, and estimate future outcomes. Predictive analytics focuses specifically on likely future outcomes. Many business solutions combine all three.

Forecast accuracy depends on the use case, data quality, history depth, forecast horizon, and the variability of the outcome. We cannot responsibly promise an accuracy figure before assessing the data. We evaluate the model on held-out data and compare it with a suitable baseline. In a recent retail forecasting proof of concept, the model achieved 30.1% WAPE (weighted absolute percentage error) on held-out stores; that was the client's first measured baseline, not a demonstrated improvement over its previous process.

It depends on data readiness, how many decisions the model must support, integration scope, and validation needs, so we don’t publish a single figure. A proof of concept scoped to one decision and one model pair is the reference shape (our most recent took 10 weeks), and the data readiness assessment tells you first whether that scope is realistic.

For simple series, you may get far with one. The harder parts are rarely the model: judging whether the history is sufficient, preventing data leakage, setting a baseline against the current process, validating against business and physical limits, and getting the output into the workflow. An assistant can produce a forecast in minutes; it can’t tell you whether the data supports trusting it. Azati’s work concentrates on those surrounding steps.

The timeline depends on data readiness, the complexity of the decision, integration requirements, and validation scope. Azati's retail forecasting example demonstrates that a deployed analytical application can be delivered within a focused proof-of-concept engagement. See the case study and project metrics above for the specific delivery timeline.

There is no universal minimum. The required history depends on how frequently the event occurs, seasonal patterns, business changes, and the forecast horizon. We assess whether the available data supports a meaningful model before selecting an approach. If it does not, improving data collection or starting with a simpler method may be more appropriate.

We can use model-specific explanation methods to show which factors contributed to an individual prediction. In Azati’s retail forecasting calculator, each forecast included a breakdown of its 15 leading drivers and their direction of influence. Explanations help users review a result, but they do not guarantee accuracy or establish causation.

We build both. Our work includes BI and video-on-demand analytics, self-service dashboards, forecasting calculators, and analytical applications. We aim to deliver the output in the format that fits the decision, whether that is a dashboard, a web tool, an API, or a signal used by another system.

A model needs to be evaluated against real outcomes after deployment. Data distributions and business conditions can change, so projects intended for ongoing use should define monitoring, review thresholds, maintenance responsibilities, and retraining requirements where applicable. These responsibilities should be agreed as part of the delivery scope.

Yes. Azati has delivered a retail forecasting calculator and an analytics copilot within client-controlled environments where data sources and credentials were provisioned by the client. The deployment model for a new project depends on the client’s infrastructure, security requirements, and available technologies.

This service focuses on analytics built around business data: forecasts, segmentation, BI, and decision support. Generative AI & Advanced ML Engineering covers machine learning and AI capabilities embedded into products and operational processes, including recommendations, anomaly detection, computer vision, NLP, and generative AI. Some projects require both capabilities.

Azati’s data scientists and engineers are based in Europe and work Central European hours, aligning with the working day in DACH and Benelux. For US engagements, collaboration arrangements depend on the client’s location, delivery needs, and project scope.

Last updated

Tell us which decision needs a number

This site is protected by reCAPTCHA and the Google Privacy Policy and Terms of Service apply.

What's next?

  • 1. Tell Us Your Story
    Describe your project. We come back within one business day with team availability and a rough plan. NDA on request before the first call.
  • 2. Get Your Roadmap
    Receive a detailed proposal with scope, team composition, timeline, and costs tailored to your goals.
  • 3. Start Building
    Azati aligns on details, finalize terms, and launch your project with full transparency.